(Originally published by the Manhattan Institute)
Executive Summary
Budget deficits have risen to nearly 6% of GDP and are projected to rise to 10% of GDP over three decades. If Congress continues to enact additional tax cuts and spending expansions, these deficits will grow even larger. To close these baseline deficits and finance additional expansions, most progressives reject most spending cuts as well as middle-class tax increases. Instead, just “tax the rich” has become an easy and popular answer. However, while there is surely room to raise some revenue from corporations and wealthy families, the plausible revenue estimates from these proposals fall far short of closing these budget gaps.
This report models an aggressive tax-the-rich agenda that pushes tax rates for corporations and wealthy families toward revenue-maximizing levels. It shows that such policies could raise, at most, 2% of GDP—and likely far less, when accounting for the macroeconomic losses that would result from layering so many new taxes on top of one another. Consequently, a sustainable economic and tax agenda would limit upper-income-tax increases to 1% of GDP.
In response to likely progressive counterarguments, this report also shows that: 1) Senator Bernie Sanders’s tax agenda has not identified additional plausible tax-the-rich policies; 2) America’s upper-income-tax rates align with international norms, and Europe’s higher tax revenues overwhelmingly result from broad-based consumption and payroll taxes; and 3) the 1950s and 1960s income tax rates exceeding 90% raised little additional tax revenue.
Given the mathematical limits of taxing the rich, policymakers should broaden their deficit-reduction strategies to include spending savings and even middle-class taxes.
Introduction
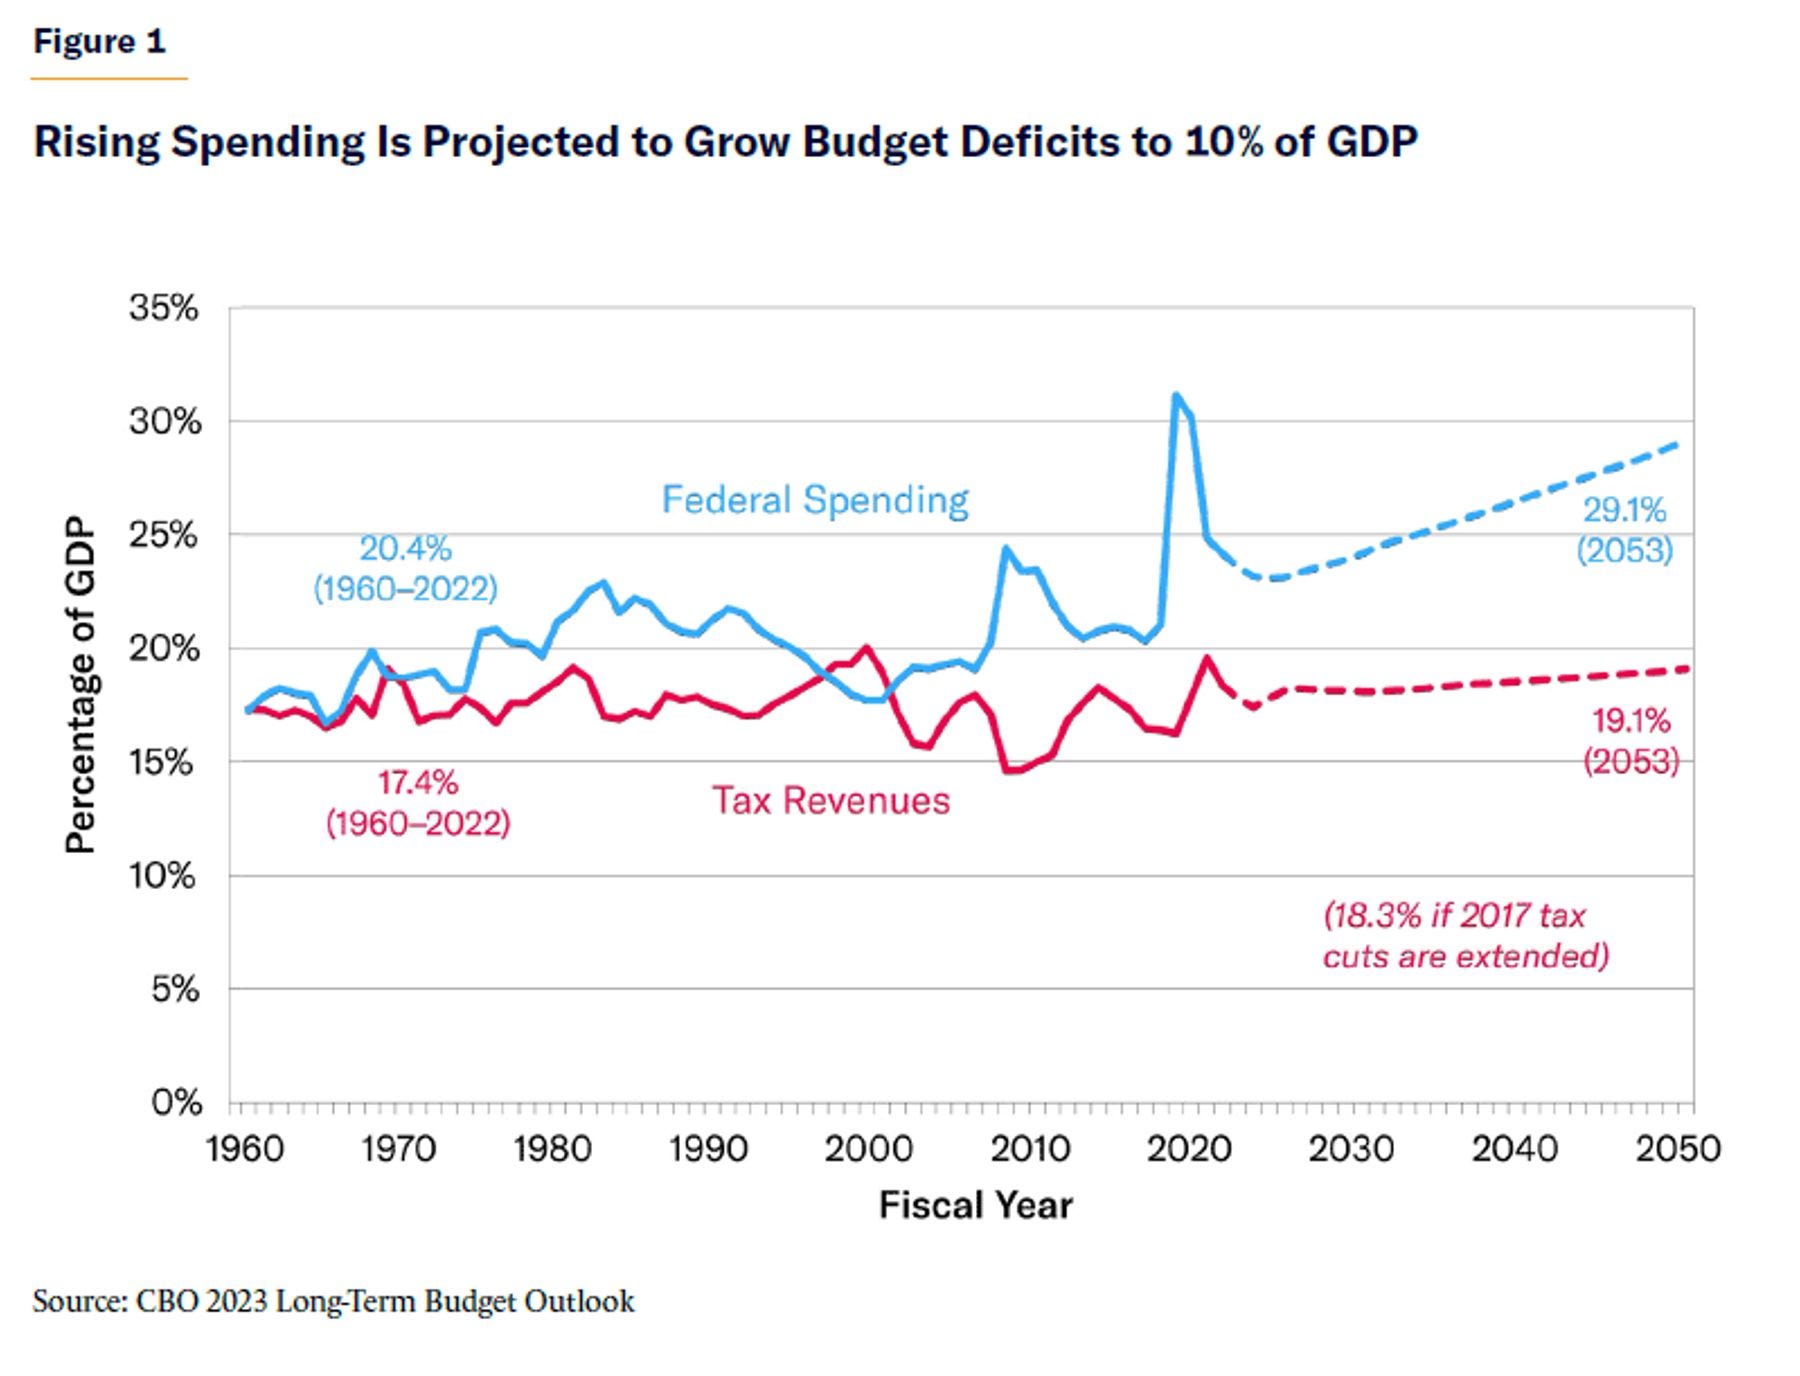
The persistent growth of budget deficits now exceeding $1.5 trillion annually, as well as the recent deluge of trillion-dollar spending proposals, has created an enormous funding challenge for the federal government. Specifically, annual budget deficits are projected by the Congressional Budget Office (CBO) to approach $3 trillion (or 7.3% of GDP) within a decade.[1] Over the long run, CBO projects that Social Security and Medicare cash shortfalls of $116 trillion over three decades will push budget deficits past 10% of GDP even in the rosy scenario of expiring tax cuts, no spending expansions, and low interest rates on the federal debt (see Figure 1).[2] Most economists believe that the likely combination of sustained deficits of 10% of GDP and a federal debt greater than 200% of GDP is unsustainable and risks a debt crisis.
Yet Washington seems more likely to expand these deficits than to curtail them. In his first two years in the Oval Office, President Biden signed legislation and executive orders that altogether expanded 10-year deficits by $5 trillion;[3] and his latest budget proposed trillions in new spending over the decade. The expected renewal of the 2017 tax cuts for most taxpayers would push annual deficits well past $3 trillion within a decade. Progressives such as Senators Bernie Sanders (I-VT) and Elizabeth Warren (D-MA) have proposed tens of trillions of dollars in new spending expansions covering health care, Social Security, climate, education, antipoverty aid, infrastructure, family leave, federal job guarantees, and child tax credits.
When pressed on how to finance budget deficits likely heading past 8% of GDP within a decade, as well as trillions of dollars in proposed spending expansions, progressive leaders and activists usually respond, “Easy! Just tax the rich!” Indeed, President Biden and many progressive lawmakers have committed to never raising taxes on the 98% of families earning below $400,000, and opposing all spending cuts involving Social Security, Medicare, Medicaid, the safety net, veterans, and most social programs. That leaves only cuts to defense spending (which has already declined to 3.5% of GDP and is projected to fall further over time) and taxing upper-income families and corporations to produce virtually all necessary savings.
President Biden and progressive leaders regularly claim that such a budget path is sustainable—that America can close deficits rising to 10% of GDP and also pay for new European-style social welfare expansions on the backs of corporations and the richest 2% of families. This makes for popular politics—everyone wants a free lunch, and taxing the rich has always been popular with voters—but even moderately informed voters understand that such a promise is mathematically—and economically—absurd. Yet the persistence of these claims raises the important question of just how much tax revenue can be raised by taxing “the rich.” Specifying the limits of taxing the rich can help us move past the false “easy answers” and begin to explore other, less popular, options to stabilize budget deficits, such as restraining the Social Security and health-care spending that are driving deficits upward, and raising middle-class taxes. In modeling various tax proposals, this report will show that:
America’s federal tax code is already the most progressive in the Organisation for Economic Co-operation and Development (OECD) and has become sharply more progressive over the past 40 years.
Much of this tax progressivity is the result of drastic cuts to low- and middle-income taxes while leaving upper-income-tax rates closer to international norms.
An aggressive tax-the-rich agenda that targets high earners and corporations could raise, at most, 1.5% or 2.0% of GDP in revenues—and likely significantly less than that.
While modest upper-income- and corporate-tax increases may not significantly harm the economy, tax rates approaching revenue-maximizing levels would substantially reduce economic growth, incomes, and wages.
Progressive leaders like Bernie Sanders have not produced tax-the-rich proposals with tax revenues exceeding the estimates in this report.
Europe’s significantly higher tax revenues are driven overwhelmingly by broad-based consumption and payroll taxes, rather than by notably higher tax rates on the wealthy.
The income-tax rates exceeding 90% in the 1950s and early 1960s produced minuscule levels of additional tax revenue.
For much of the past 50 years, budget deficits were small enough that raising taxes by 1% of GDP on corporations and high-income families could have solved much of Washington’s fiscal challenges. However, baseline budget deficit projections—as well as the cost of progressive spending proposals—have grown so steeply that the usual tax-the-rich options can no longer come close to filling this gap. Either middle-class taxes must also rise sharply, or Washington’s spending appetite must be pared back.
Specifically, stabilizing the federal debt at 100% of GDP over the long term—which would far exceed the post-1960 average of 45% of GDP—would require non-interest savings beginning at 2% of GDP and ramping up to 5% of GDP over the next three decades. (The resulting interest savings from a smaller debt would provide the rest of the savings.) These figures assume the renewal of the 2017 tax cuts (as there is strong bipartisan support for extending the tax cuts for the bottom-earning 98% of earners)[4] but do not assume any additional spending expansions, tax cuts, or economic crises—all of which would also have to be fully offset to meet this debt target. In short, the non-interest savings required to stabilize the debt will almost surely rise past 5% of GDP when accounting for additional spending and tax-cut legislation. Taxing the rich cannot close more than a small fraction of this gap.
In order to avoid the partisan misrepresentations that typify tax policy debates, it is important to clarify, at the outset, that this report is not a conservative antitax manifesto. It does not argue that upper-income taxes should not be raised at all. Nor does it claim that all tax cuts pay for themselves. Indeed, soaring deficits will require some tax increases to accompany the necessary spending reforms.
Instead, this report employs consensus economic modeling and research to build a more realistic framework for taxing the rich—and to rein in the unrealistic perception that taxing the rich can sufficiently eliminate budget deficits and finance the progressive agenda. The limits of upper-income taxes should induce lawmakers, analysts, and voters to broaden their savings proposals to include substantial spending reforms and even to consider middle-class tax increases.
Background: Washington’s Progressive Tax Code
As background, the U.S. is a relatively low-tax nation with a highly progressive federal tax code. Total federal, state, and local tax revenues in 2021 totaled 26.6% of GDP, making it 32nd of the 38 OECD countries, which averaged revenues of 34.1% of GDP.[5] A nation born from a tax rebellion has long maintained a more libertarian resistance to exorbitant broad-based taxes, even as Europe built expensive social democracies in the decades following World War II.
At the same time, the taxes that America does collect—particularly at the federal level—are extraordinarily progressive. America’s corporate, capital-gains, and estate-tax rates exceed those of much of Europe and OECD. Even America’s top income-tax brackets are within the norm of other major economies. But there are two unique features of U.S. tax collection.
First, America’s comparatively lower tax revenues overwhelmingly result from being the only OECD nation without a value-added tax (VAT). The average 7.2% of GDP raised by VATs accounts for 96% of the total tax-revenue gap between America and the OECD average. Excluding VATs, OECD nations collect 26.9% of GDP in taxes, compared with America’s 26.6%.[6]
Second, America taxes lower- and middle-income families at a substantially lower rate than other major economies. Decades of refundable child tax credits, earned income-tax credits, increased standard deductions, and lower marginal tax rates have essentially moved half of all families off the federal income-tax rolls. America’s non-wealthy families also benefit from lower payroll-tax rates than other nations and, most important, the lack of a VAT.
Consequently, an OECD study in 2008 concluded that—even when controlling for income inequality—the U.S. had the most progressive income and payroll-tax code in OECD.[7] Specifically, the highest-earning decile of American families pay a share of the nation’s income and payroll taxes that is 35% greater than its share of the total income earned—compared with an average of 11% across OECD. And these income- and payroll-tax figures even understate America’s relative progressivity by excluding the VATs that further drag down other nations’ overall progressivity levels.
Washington’s income taxes are extraordinarily top-heavy. Treasury data show that, in 2023, the bottom 40% of earners collectively pay no income tax and will instead receive a collective tax rebate of $123 billion. The middle-earning quintile pays an effective income-tax rate of just 2.2%, while the second-highest quintile pays an effective rate of 5.7%. Even when including all payroll and other federal taxes, the middle-earning quintile still pays only 11.9% of its income in federal taxes, and the second-highest quintile pays 16.2%. Overall, the bottom-earning 60% of families altogether financed just 23 days of federal spending in 2023.[8]
Meanwhile, the top-earning quintile—while earning 58% of all income—pays 69% of all federal taxes and 90% of all income taxes. And the top 1% of earners—while earning 18% of all income—pay 25% of all federal taxes and 40% of all income taxes. By contrast, the bottom-earning 60% earns 23% of all income, yet pays just 13% of the total federal taxes, including a combined negative income tax.[9]
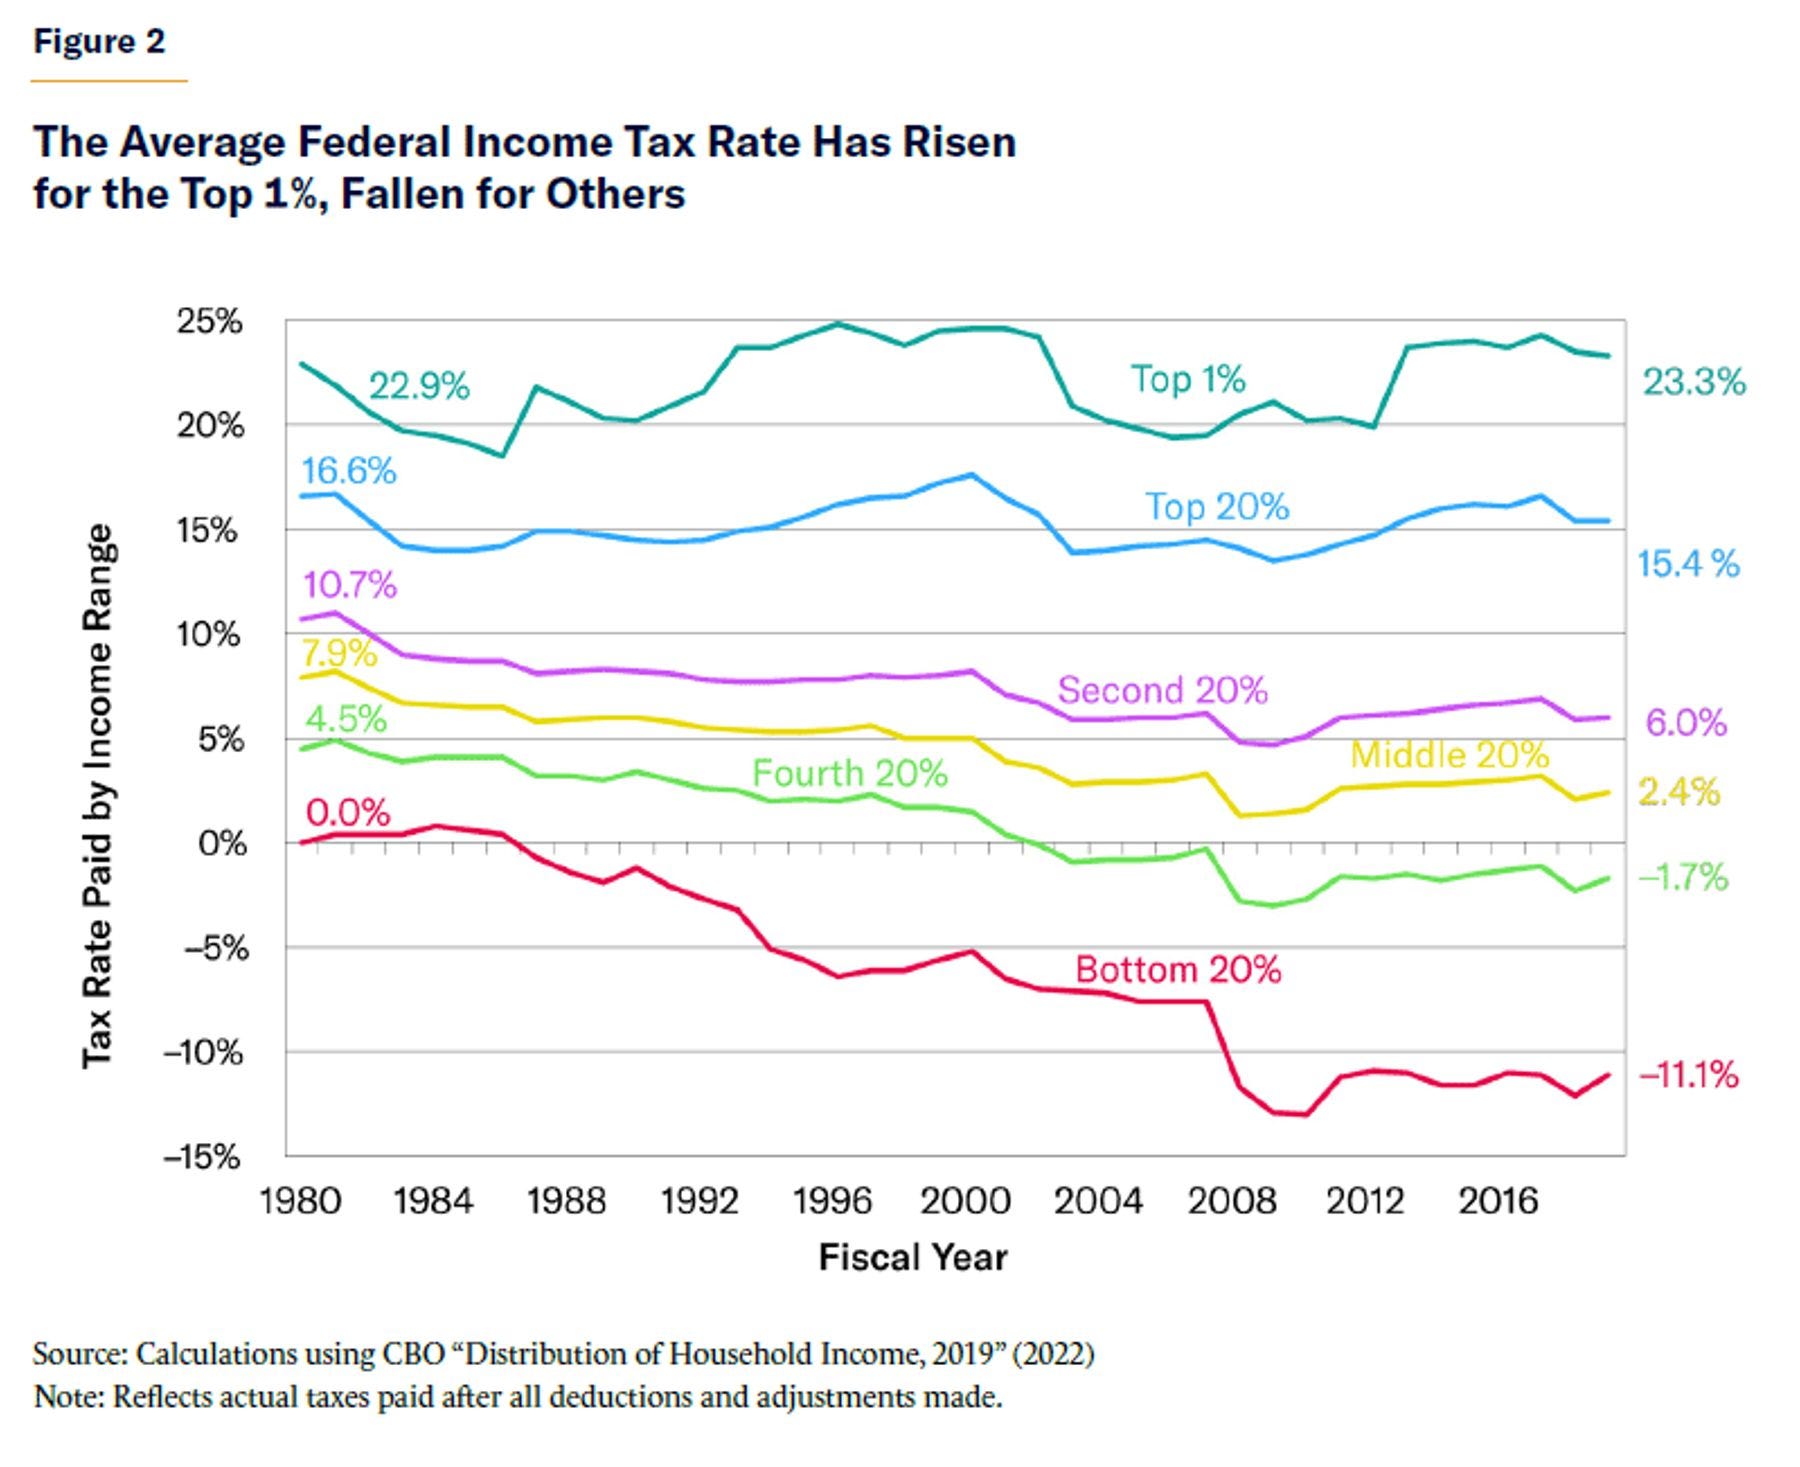
In contrast to conventional wisdom, the federal tax code has grown significantly more progressive over time. Figure 2 shows that, since the election of Ronald Reagan, effective income-tax rates have fallen dramatically for middle- and low-income earners while slightly rising for the top-earning 1%. Between 1980 and 2019 (the latest year available), the effective income-tax rate for the middle-earning quintile collapsed by more than two-thirds, from 7.9% to 2.4%. The bottom-earning two quintiles saw their effective income-tax rates fall by 8 percentage points into negative tax rates. Meanwhile, the top-earning quintile’s income-tax rate fell by much less, from 16.6% to 15.4%. And—most surprising—the effective income-tax rate for the top-earning 1% slightly rose from 22.9% to 23.3%.[10] Even as the top income-tax rate dipped, soaring incomes for the top 1% left more of their earnings in the top tax bracket, pushing up their effective tax rate.
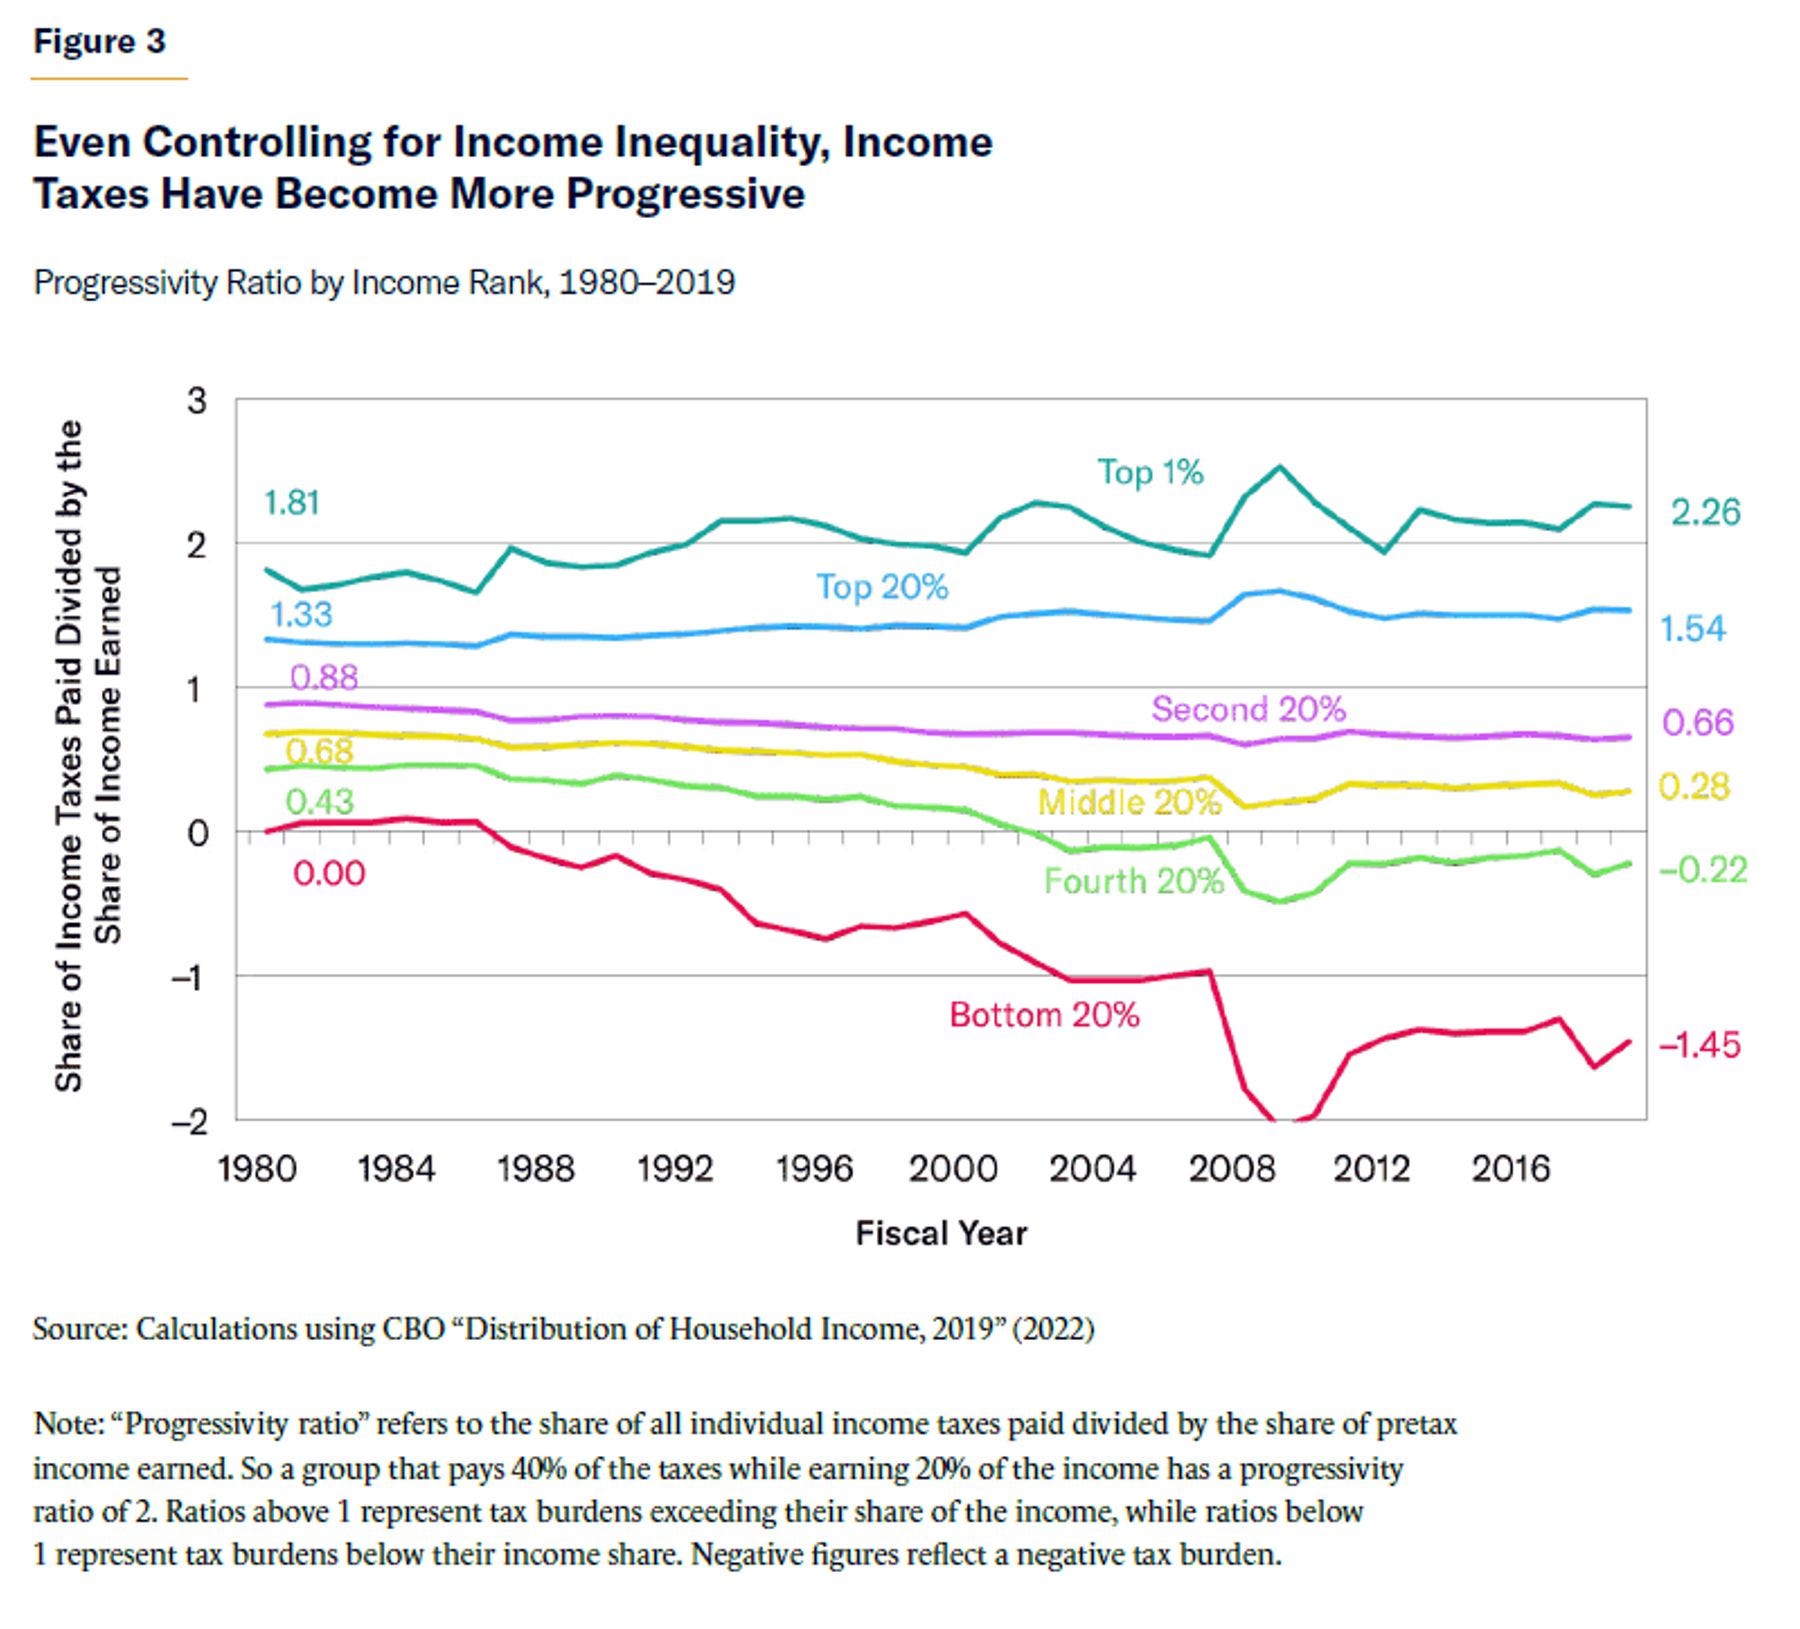
At the same time, the income tax has become more progressive even adjusting for changes in income inequality. Adopting the OECD methodology above, we can divide each income group’s share of the taxes paid by its share of the income earned—essentially adjusting tax shares for changes in income equality over time. A “progressivity ratio” greater than one means that an income group is paying a higher share of the income taxes than its share of the income earned. A ratio of exactly one means that a group’s share of income taxes paid matches its share of the income earned (a perfectly proportional system), while a ratio below one means that their tax share is less than their income share. Negative ratios reflect negative tax rates.[11]
For the top-earning 1%, Figure 3 shows that the progressivity ratio has increased since 1980 from 1.81 to 2.26 (meaning that its share of the federal income taxes paid has risen to 226% of its share of the income earned). The progressivity ratio of the highest-earning 20% of taxpayers has risen from 1.33 to 1.54. The ratio has fallen for every other income quintile, including the second highest income quintile (from 0.88 to 0.66), the middle (from 0.68 to 0.28), fourth (0.43 to –0.22), and bottom (0.00 to –1.45).
Other measures of tax progressivity consider the amount of redistribution from the rich to the poor, such as by examining changes in after-tax income. By those measures, Washington’s tax code is less redistributive than other nations’ tax systems because it has a smaller footprint. America does not raise enough taxes to redistribute as much money as some other nations do. However, for the amount of tax revenue that Washington does collect, it is overwhelmingly dependent on the top-earning 20% of taxpayers, and it shields lower-earning families from nearly all taxes except payroll taxes. This means that there is likely more fiscal space to raise taxes on non-wealthy earners than the wealthy, even if upper-income taxes may be a popular place to start.[12]
How Much Tax Revenue Can Be Raised from the Wealthy?
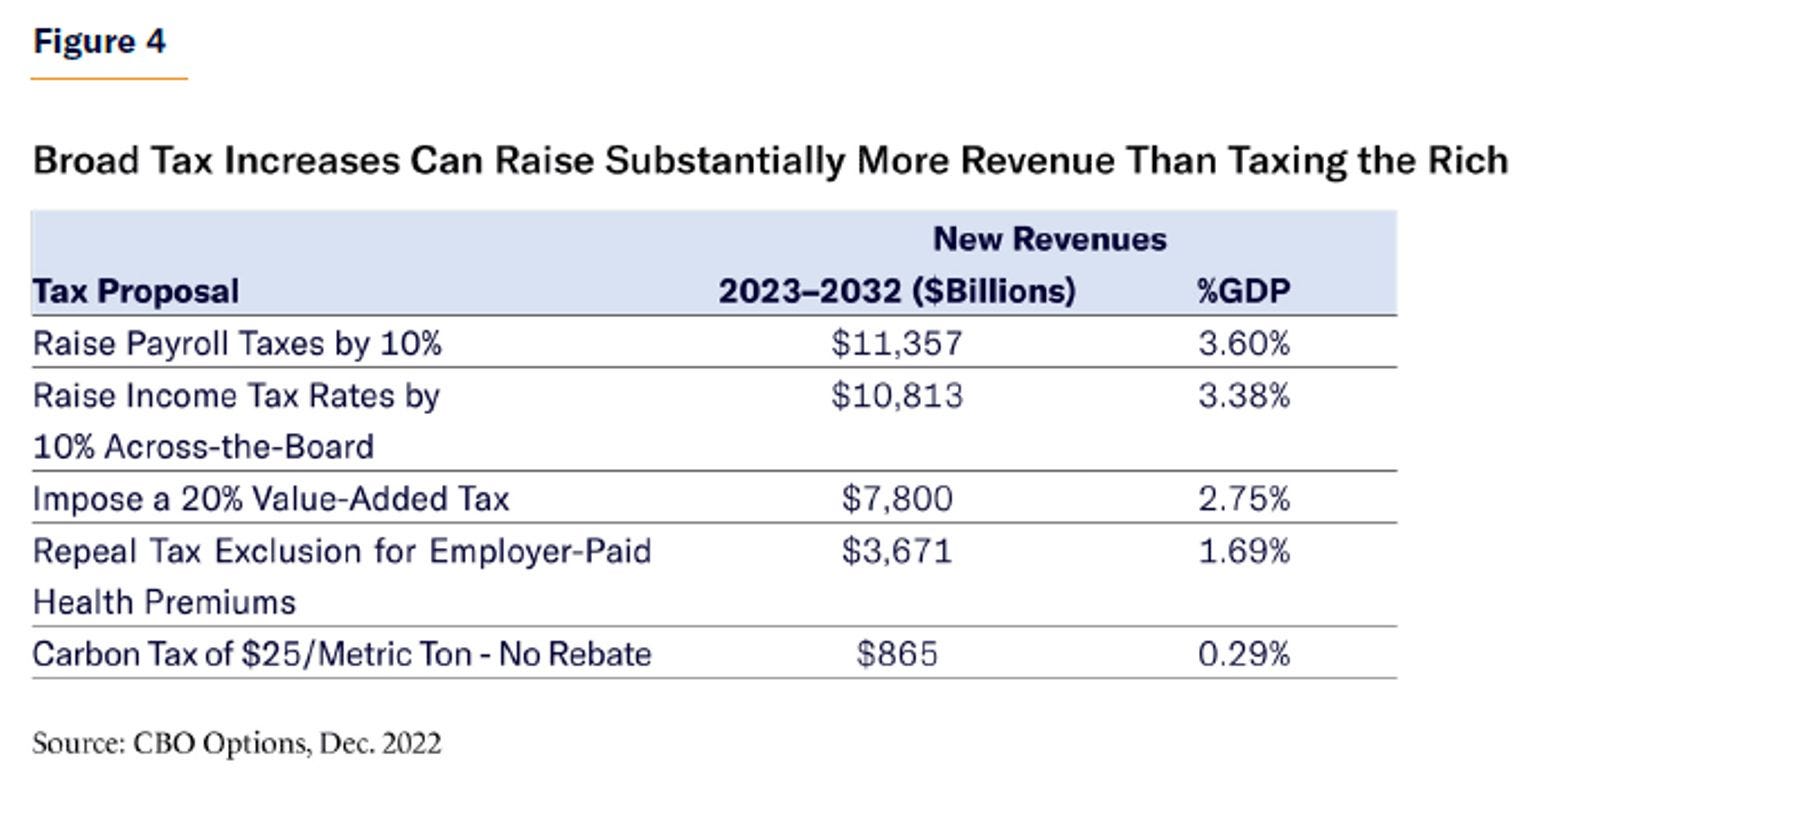
The following section calculates how much tax revenue can be raised from the wealthy through income, payroll, investment, corporate, estate, and wealth taxes. In most instances, each tax is first modeled to show the total amount of untaxed income above the wealthy thresholds—which approximates the theoretical amount that could be raised with 100% tax rates. The next step incorporates consensus economic research on the revenue-maximizing tax rates when incorporating economic and behavioral responses. From there, the amount of revenue from those tax rates is estimated, as well as any additional revenue that can be raised from plausible reforms to close the tax gap (the amount of unpaid taxes) and pare back tax preferences. For individuals, “wealthy” is typically defined as families with earnings in the top 1% ($686,100 for a family of two in 2023), although, in some cases, the income threshold falls to $400,000. Ultimately, this section will show that taxing the rich at revenue-maximizing rates would raise, at most, 2% of GDP—but that, after accounting for macroeconomic responses, the real figure is likely 1%–2% of GDP. (see Figures 4 and 5).