

(Originally published by the Manhattan Institute)
The end of the Obama presidency now allows for an overall assessment of taxes, spending, and deficits during his years in office. The analysis in this paper begins with the 10-year budget baseline that Obama inherited in January 2009 and measures subsequent tax and spending changes through the January 2017 baseline released as he left office. The data come from more than 20 Congressional Budget Office baseline updates over the administration’s eight years, supplemented with the line-item scores of approximately 110 major bills that Obama signed into law.
The cumulative 2009–19 budget deficits are set to end up at $8.93 trillion—$4.6 trillion higher than projected for the same time period when Obama took office.
The economy grew more slowly over this decade than was projected in 2009. Yet far from deepening the budget deficits, the slower economic recovery and technical changes saved $400 billion over the decade relative to the January 2009 baseline, as lower tax revenues were offset by lower interest payments on the national debt, the result of recession-dampened interest rates.
New legislation cost $5.0 trillion over the 2009–19 period. However, $4.1 trillion of this “cost” came from basic extensions of expiring taxes including the Bush-era tax cuts. Economic stimulus added $2.0 trillion in spending, and discretionary spending caps and mandatory sequestrations saved $800 billion.
The Affordable Care Act reduced the 2009–19 budget deficit by $275 billion, as its tax increases and Medicare cuts exceeded the cost of new health benefits. But the health law has made balancing the long-term budget more difficult by using most of the tax increases and Medicare cuts to finance a new entitlement rather than deficit reduction.
Virtually all net spending increases during the Obama administration were enacted during 2009–10, when Democrats controlled Congress. During the following six years, with a Republican House and eventual Republican Senate, $889 billion in net spending cuts were enacted, excluding legislation that simply extended expiring policies.
Obama leaves behind a budget with higher entitlement spending, lower discretionary spending, and (temporarily) lower net interest costs than originally projected. The ballooning national debt leaves taxpayers liable for exorbitant debt service costs when interest rates return to normal levels.
$4.6 Trillion in Additional Federal Deficits
Upon taking office in January 2009, President Obama inherited a budget deficit that had soared from $161 billion in 2007 to a recession-slammed $1.186 trillion estimate for 2009. The January 2009 CBO baseline budget projection for 2009–19—which already incorporated the effects of the year-old recession in its projections—estimated that a strong economic recovery and the expiration of certain tax cuts would return the annual budget deficit to approximately $260 billion by 2012. In other words, the projections assumed that the high recessionary deficits would quickly fall back to earlier levels. Overall, CBO estimated that there would be $4.32 trillion in total budget deficits over the decade.
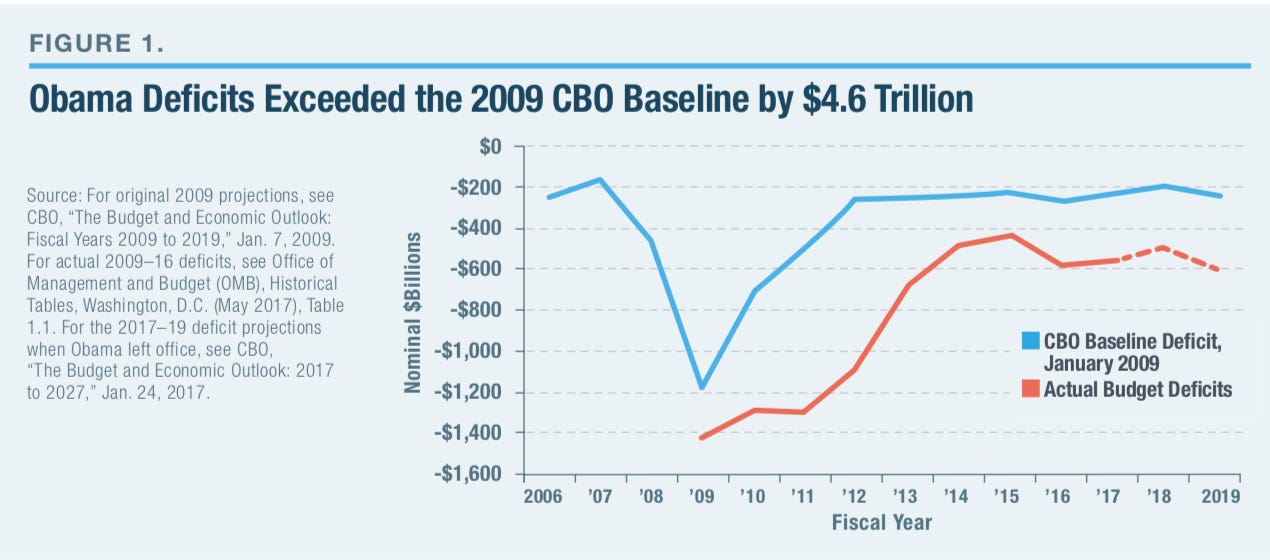
That is not what happened. Figure 1 shows that, as Obama left office, the 2009–19 budget deficits were now estimated to total $8.93 trillion—more than double the initial projections. Annual budget deficits remained above $1 trillion through 2012, fell to $438 billion by 2015, and have since begun rising once again. While current deficits of 3% of the Gross Domestic Product (GDP) are not historically atypical, they are significantly higher than the default baseline when Obama took office.
These deficits also exceeded the president’s own targets. A month after his inauguration, Obama pledged to “cut the deficit we inherited by half by the end of my first term in office.”[4] Instead, the inherited $1.186 trillion was pushed up to $1.413 trillion by 2009 stimulus legislation, and then remained over $1 trillion throughout the president’s first term (Figure 2).
It was not until 2014 that the budget deficit fell to half the inherited level in nominal dollars (2013, if measuring by percentage of GDP).
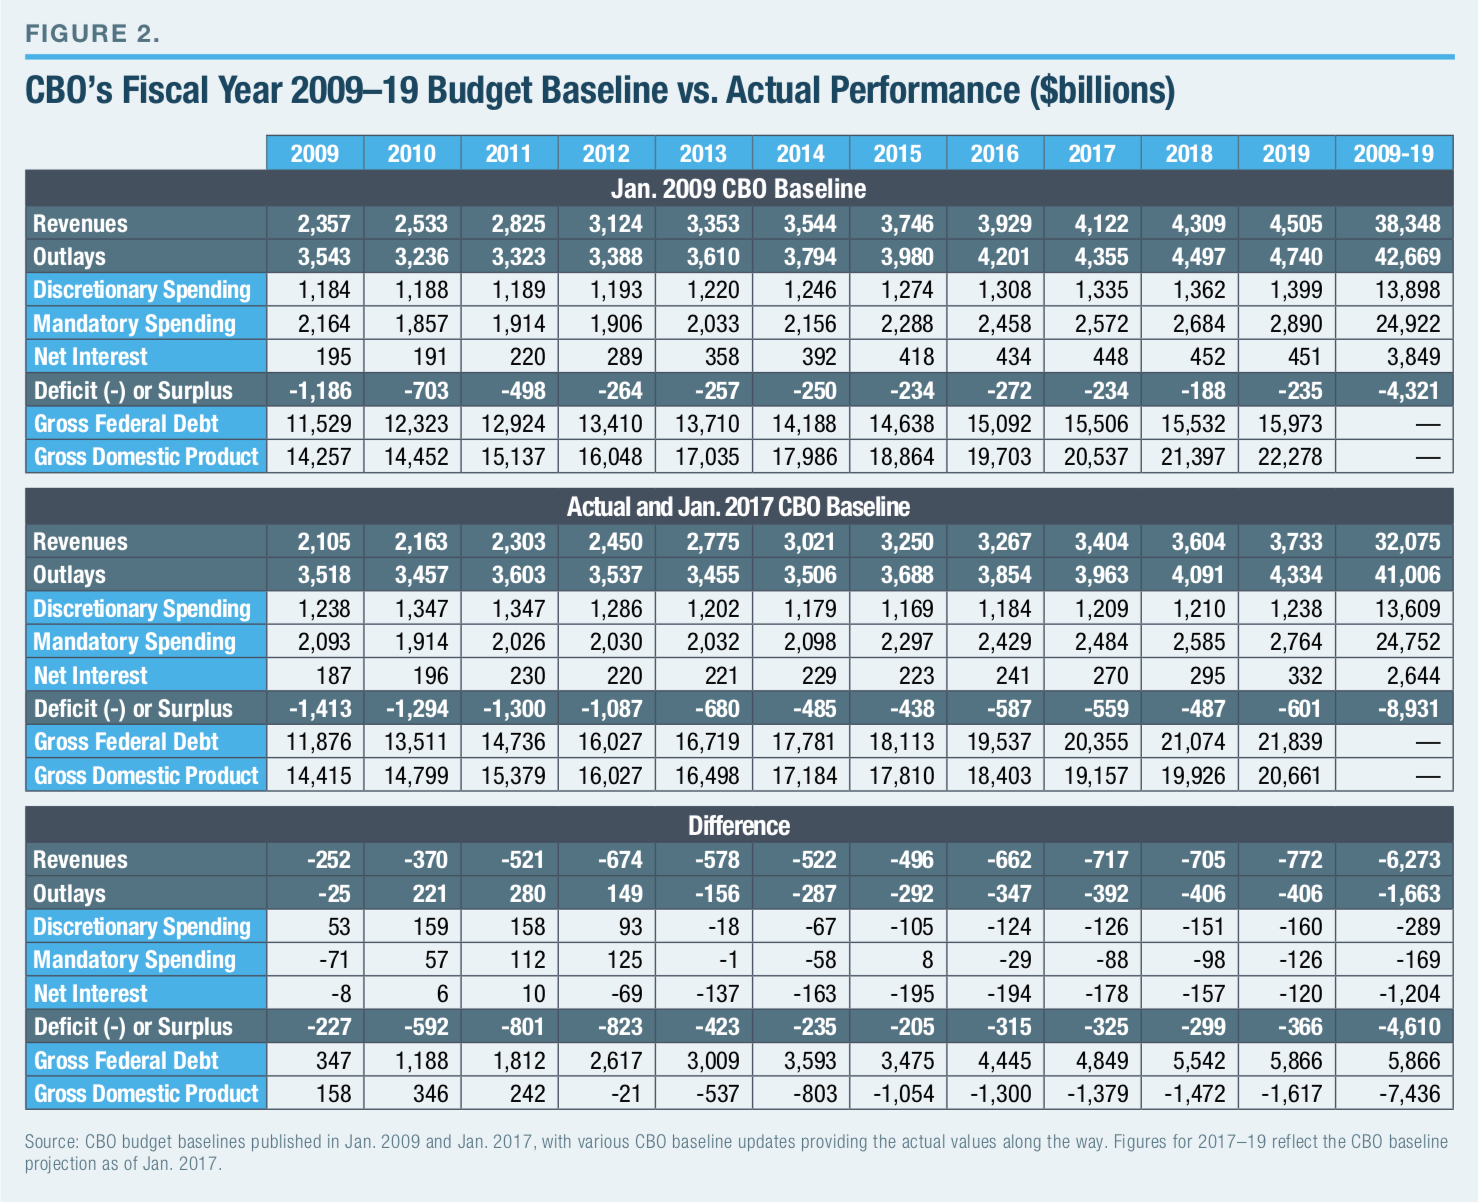
Had the president and Congress simply stuck to CBO’s original budget baseline legislatively (even allowing for budget effects of the weak recovery), the deficit would have fallen well below $300 billion by 2013 and approached balance by 2018. Instead, expensive new policies slowed the deficit reduction, leading to $8.93 trillion in red ink rather than $4.32 trillion—which is $4.6 trillion in additional deficits. Readers can determine which new costs were justified, and which were not.
Higher Deficits Were Not the Result of the Weak Economic Recovery
Conventional wisdom blames the persistently high budget deficits in the Obama years on the unexpectedly weak economic recovery. In 2012, for example, the president asserted that he had failed to meet his own deficit-reduction targets “because this recession turned out to be a lot deeper than any of us realized.”[5]
To be sure, the 2009–16 economy grew at barely half the 2.6% annual rate that CBO projected in January 2009. By the end of 2019, CBO now projects the economy to produce $7.4 trillion less output than it projected for these 10 years in January 2009. This translates into $1.9 trillion in forgone tax revenues. An additional $1.2 trillion in projected tax revenues was lost to technical revisions and other factors that are often intertwined with the underperforming economy.[6]
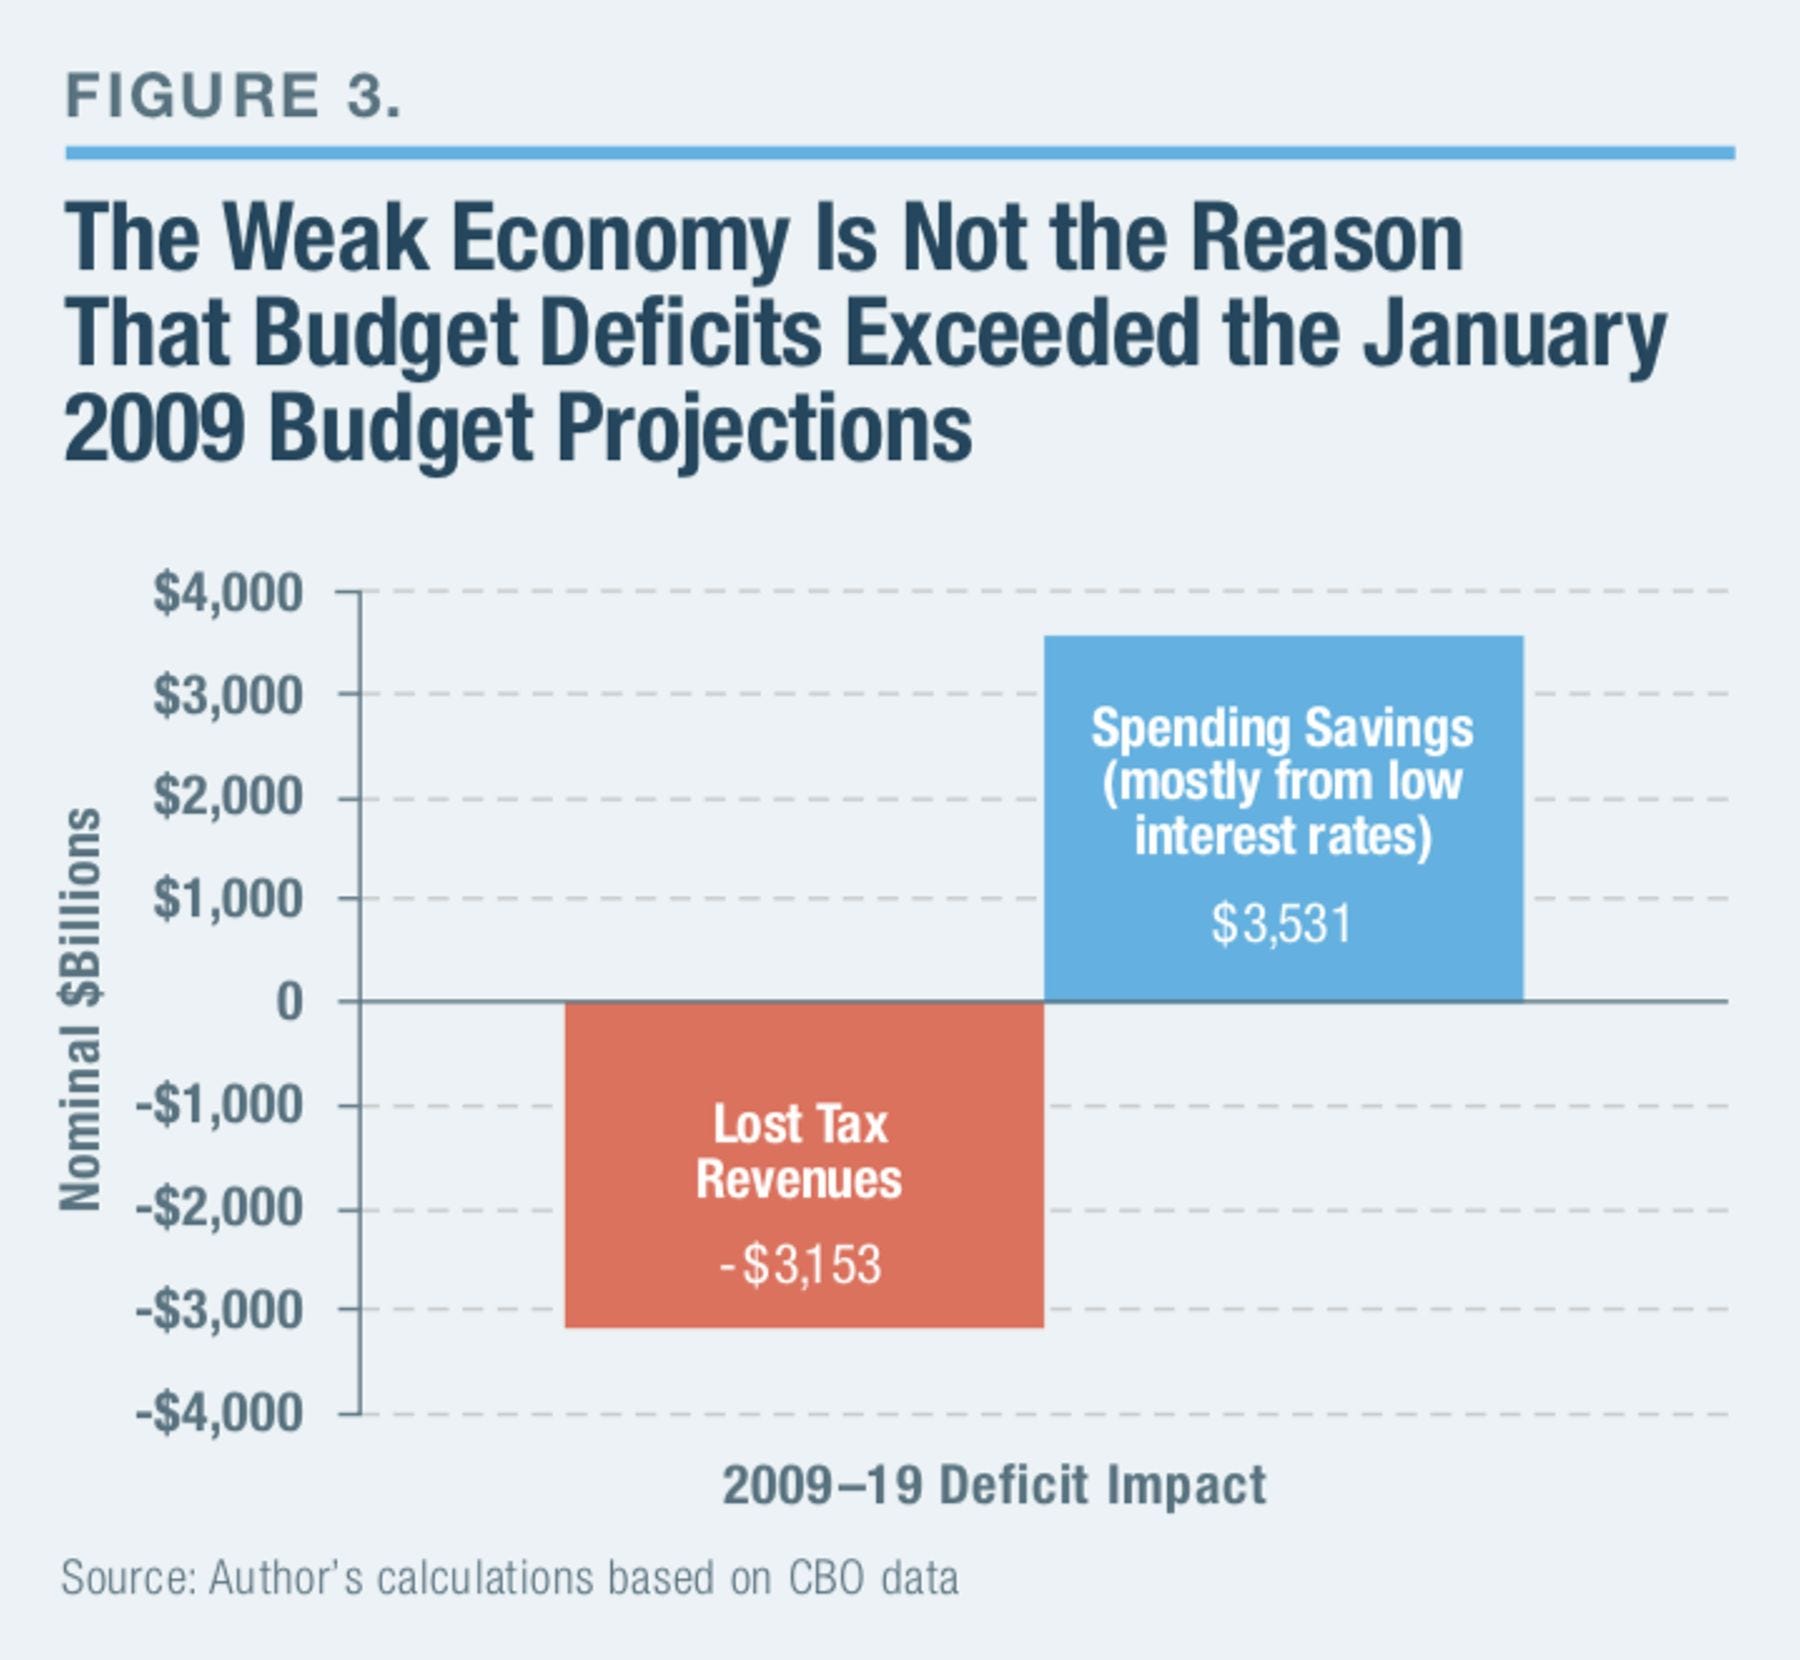
That is only half the story. The same sluggish economy and technical re-estimates that reduced tax revenues by $3.1 trillion also automatically reduced spending by $3.5 trillion over the decade—leading to a modest net reduction in the 10-year budget deficit relative to the January 2009 baseline.
The main source of lower spending: $2.3 trillion less in interest payments on the national debt, thanks to lower interest rates. These lower interest rates were a direct result of the weak economy and the Federal Reserve’s policy of keeping its target interest rates near zero, to spark growth. Consider that between 1996 and 2016, the national debt quadrupled, from $5 trillion to $20 trillion, yet interest payments were lower in 2016 than in 1996.[7] Had the original 2009 CBO interest-rate assumptions held, the federal government would be paying a $620 billion interest tab in 2017, rather than $270 billion.
That is the good news. The bad news is that when interest rates paid by Washington return to a historically normal range of 5%–7% (or even higher, because of the soaring national debt), federal spending will explode by hundreds of billions—or even trillions—of dollars.
In addition to low interest rates, the slow economic recovery and technical re-estimates saved $820 billion in mandatory program costs through developments such as lower automatic inflation adjustments and lower than projected spending on Medicare Part D. Finally, $397 billion was saved from faster than projected repayments of the 2008 financial bailouts as well as the rapid recovery of deposit insurance and government mortgage-guarantee institutions that had cratered in 2008. All told, this $3.5 trillion in nonlegislative spending savings exceeded the $3.1 trillion in lost tax revenues (Figure 3).
Even during the 2009–12 period of trillion-dollar deficits, the net budgetary loss to economic and technical revisions (relative to the January 2009 baseline) averaged about $50 billion annually.[8] Since then, these factors have provided a net savings of approximately $100 billion annually, as net interest and mandatory program savings, such as those described in the last paragraph, continue to grow rapidly.
Overall, the weak economy and technical re-estimates reduced deficits by $400 billion from the original 2009–19 budget projections. This offset some of the $5 trillion in new legislation, leading to a sum of $4.6 trillion in net additional deficits over this period.
$5 Trillion in New Legislation
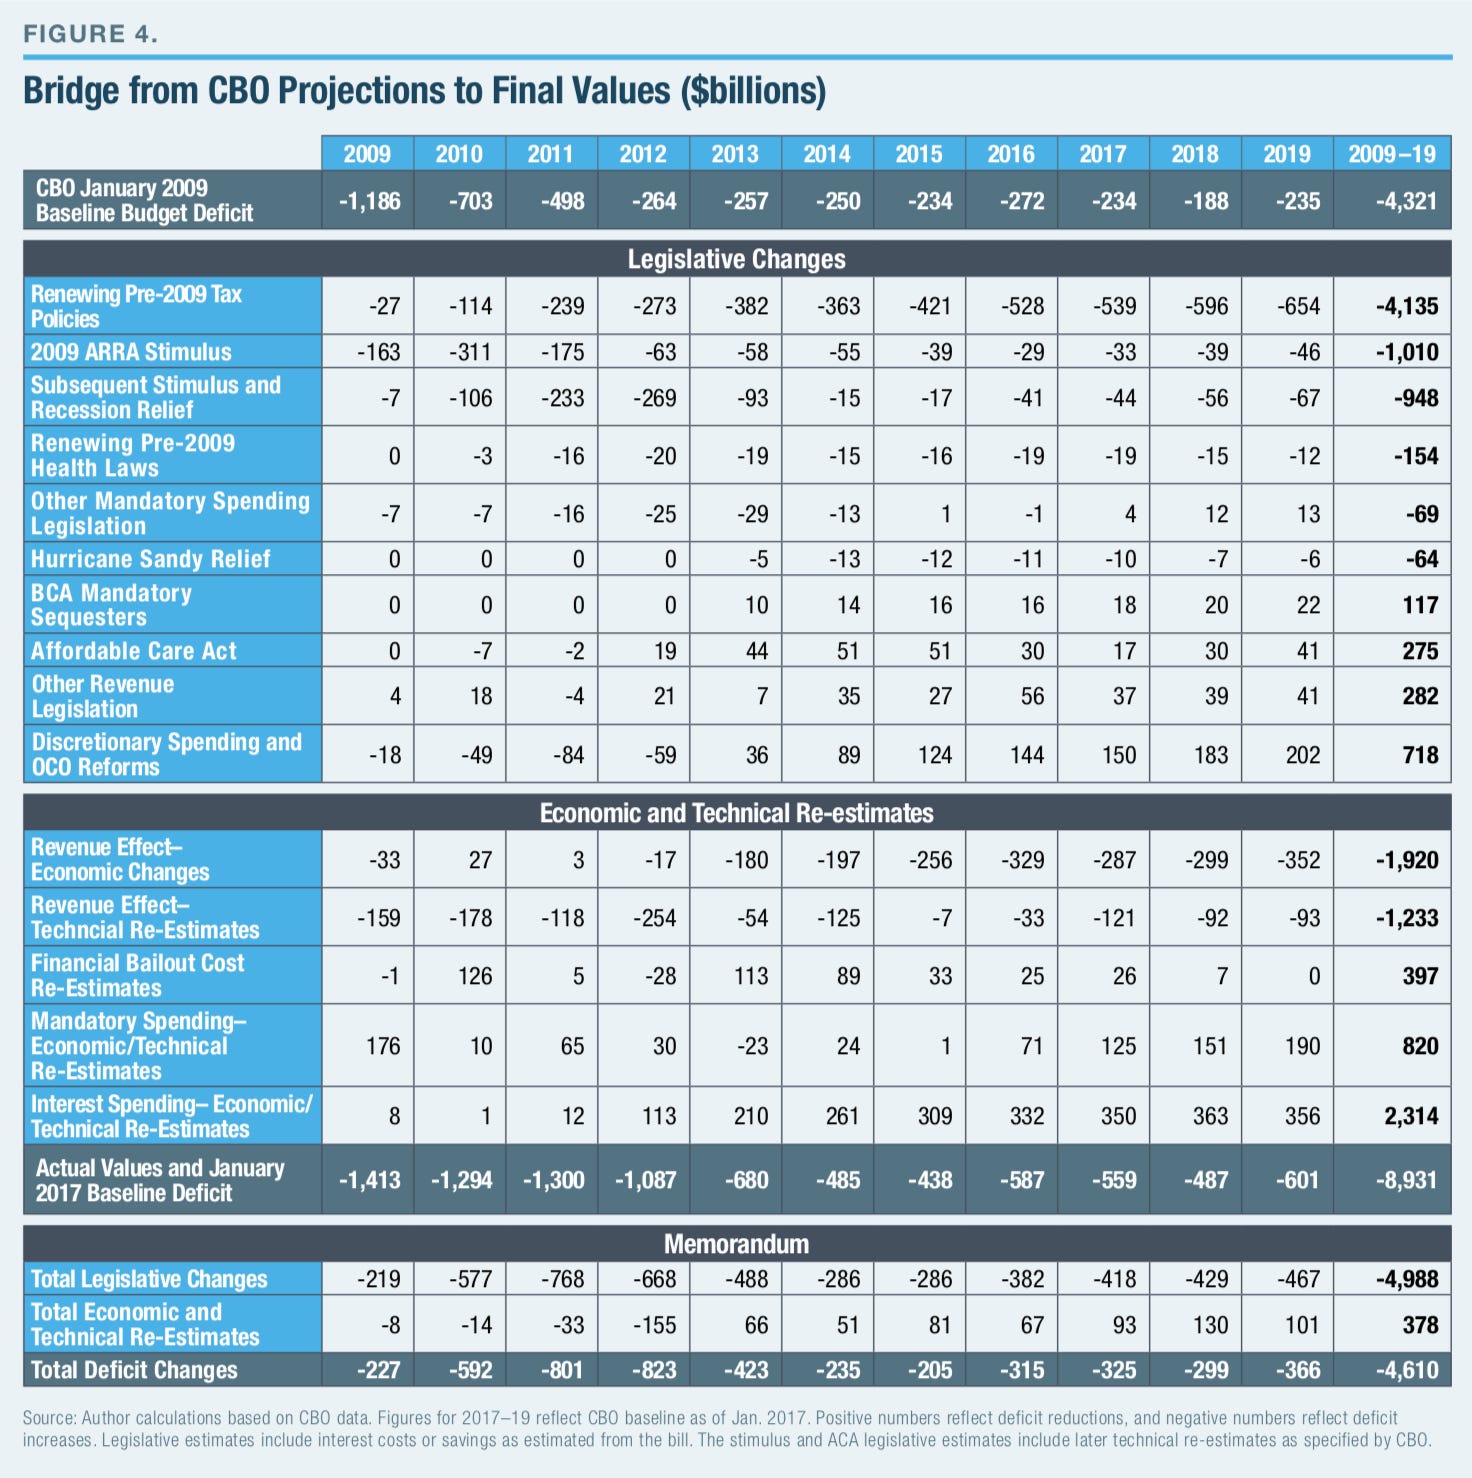
In eight years, President Obama signed legislation that cumulatively added $4,988 billion in budget deficits over 2009–19. Taxes were reduced by $3.120 trillion, program spending increased $758 billion, and $1.110 trillion in interest costs resulted.[9] The main components are summarized in Figure 4, and some details are explained below.
1. Extending tax cuts inherited from previous administrations ($4,135 billion). The most expensive bills signed by President Obama did not reflect major policy changes; they were instead extensions of tax cuts that had been scheduled to expire. This includes extensions of the 2001 and 2003 tax cuts originally signed by President George W. Bush ($1,660 billion), the Alternative Minimum Tax (AMT) “patch”[10] ($1,247 billion), and a series of small tax cuts known as the “tax extenders” that Congress regularly renews every December ($481 billion).
Because this raised the national debt, it also added $747 billion in interest costs. Following a two-year extension enacted in December 2010, the AMT patch and most of the 2001 and 2003 tax cuts were finally made permanent in January 2013, and many annual tax extenders were made permanent in December 2015.
There is a persuasive argument that these extensions should have been incorporated into the original CBO baseline rather than counted as “new” tax cuts. After all, a baseline is supposed to show the tax and spending effects of maintaining current policies. Instead, the January 2009 baseline assumed the expiration of the tax policies above and thus the implementation of $5 trillion in new tax increases (including interest costs) over the next decade, the vast majority of which would later be canceled by a bipartisan congressional majority.
Yet controversial budget rules classified this simple continuation of current tax policies as a new $4 trillion tax cut.[11] It is true that the baseline merely reflected expiration dates that were written into these tax cuts (partly because of other arcane budget rules). Yet CBO’s baseline projections regularly assume that expiring entitlement programs (such as farm subsidies) will be extended and that Social Security and Medicare benefits will continue to be fully paid, even after their trust funds are exhausted. Simple consistency suggests that the baseline should have also assumed these tax policy extensions in the original baseline (and scored their long-term cost when originally enacted), rather than counting them as expensive “new” tax cuts.
Based on a current-policy baseline (which assumes the renewal of existing policies), Obama and Congress actually raised net taxes. The January 2013 legislation made permanent the 2001 and 2003 tax cuts for most taxpayers but allowed tax rates to rise for upper-income families and small businesses by an estimated $600 billion over 10 years, relative to the tax policies at the time. Certain tax-cut extenders have been scaled back as well, and new taxes were imposed to pay for the Affordable Care Act (ACA) as well as for children’s health care (tobacco taxes). The net effect is a 2017 tax code designed to raise more revenue from a given income distribution than the 2008 tax code.
2. Economic stimulus policies ($1.958 trillion). Shortly after taking office, President Obama and the Democratic Congress enacted the American Recovery and Reinvestment Act (ARRA), which included $748 billion in new “stimulus” provisions plus $262 billion in net interest costs over the decade. Over the next several years, this was followed by an additional $716 billion in economic stimulus and recession relief costs, including payroll tax holidays ($226 billion), emergency unemployment-insurance extensions ($191 billion), and extensions of new 2009 stimulus tax relief involving the Earned Income Tax Credit (EITC), Child Tax Credit (CTC), American Opportunity Tax Credit (AOTC), and various business-tax cuts ($187 billion). Net interest costs added $231 billion to this last round of stimulus policies, which were mostly contained to 2009–14, except for the permanently extended EITC, CTC, and AOTC provisions.
3. Discretionary spending cuts and mandatory sequestrations ($835 billion saved). Following an initial surge, discretionary spending proved to be the source of large budgetary savings in the Obama years. More than $300 billion in “emergency” discretionary spending was included in the 2009 stimulus bill described above. Two years later, a new House Republican majority demanded and received a $2.1 trillion spending cut over 10 years, in exchange for raising the debt limit by an equal amount. Because a congressional “Super Committee” created by the 2011 Budget Control Act (BCA) deadlocked in its attempt to find alternative budget savings, the BCA ended up imposing most of its cuts within discretionary spending. Specifically, the law created 2013–21 statutory discretionary spending caps that were $1.3 trillion below the CBO discretionary spending baseline. The remaining savings would come from modestly sequestering a small sliver of mandatory spending (such as Medicare), as well as lower interest costs.
Overall, discretionary outlays—excluding 2009 emergency stimulus spending and Hurricane Sandy relief—are set to come in $640 billion below the inherited 2009–19 baseline level. These reductions consist of defense discretionary spending ($506 billion below baseline) and nondefense discretionary spending ($423 billion below baseline)—partially offset by additional emergency supplemental funding for Overseas Contingency Operations (OCO), such as in Iraq and Afghanistan ($290 billion above baseline). This $640 billion in program savings also produced $78 billion in net interest savings and combine with the BCA’s mandatory sequester savings ($98 billion plus $19 billion in interest savings) to arrive at the $835 billion saved.
The savings listed above are far less than the initial BCA score because: 1) this paper’s 2009–19 analysis period cuts off the BCA’s larger savings years of 2020 and 2021; 2) Congress has broken the discretionary caps by more than $150 billion so far, mostly in return for slowly phased-in entitlement reforms; and 3) Congress has proved adept at using budgetary gimmicks to slip in extra spending. Despite this backsliding, the BCA represents one of the largest spending cuts in several decades.
4. Affordable Care Act ($275 billion saved). Shortly after its enactment, CBO estimated that the ACA would collect $526 billion in revenues (mostly from taxes on the health industry and upper-income families) and spend $401 billion over 2009–19—for a net deficit reduction of $125 billion.[12] The president and Congress subsequently reduced the law’s savings by repealing or delaying $50 billion in taxes, fees, and fines (while also saving $14 billion in spending). Yet the ACA’s total budgetary cost has continued to fall because of factors outside lawmakers’ control. Specifically, lower than expected enrollment in the health-care exchanges and the Supreme Court ruling making the state Medicaid expansion voluntary saved $279 billion in federal subsidies, while also reducing revenues by $79 billion over the decade (mostly through reduced risk-adjustment transfers). The decision by the Department of Health and Human Services to cancel the CLASS Act—an actuarially unsustainable long-term-care program that had been included in the original ACA—cost $65 billion.[13] Finally, $52 billion was saved in net interest costs because of the rest of the law’s deficit reductions.
Altogether, the $125 billion in original projected savings was reduced by $36 billion through subsequent legislation and by $65 billion from the cancellation of CLASS. Yet the budget picture benefited from $200 billion in savings outside lawmakers’ control (mostly due to decreased exchange enrollment) and $52 billion in net interest savings. The result is $275 billion in overall 2009–19 savings.[14]
Net deficit reduction does not necessarily mean that the ACA was fiscally responsible. The original law was estimated to provide $788 billion in new health-care benefits over the decade, offset by $931 billion in new taxes and cuts to programs like Medicare (excluding education savings). Given that entitlement spending is on a completely unsustainable path, there is a reasonable argument that the limited supply of realistic spending and tax offsets should have gone toward shoring up Social Security and Medicare, rather than funding a new government program. Instead, Washington added another expensive entitlement to its long-term obligations and reduced the supply of available offsets to address the upcoming deluge of debt. The task of balancing the long-term budget was made more difficult by the ACA.
5. Health extenders ($154 billion). Just as the CBO baseline had assumed large new tax increases, it also assumed that Medicare physician reimbursement rates would be allowed to fall by as much as 21% (based on a 1997 law), even though Congress had moved to prevent these cuts every year since 2002. During the Obama presidency, lawmakers continued to extend the current Medicare physician payment structure (as well as extending other small health laws), while often cutting other health-provider payments as offsets (thus cutting net spending relative to a current-policy budget baseline). Finally, in 2015, Congress made the Medicare “doc fix” permanent (and even expanded payment rates by $33.5 billion over the following decade) without major offsets. Overall, most of this $154 billion in spending is consistent with a current-policy baseline.[15]
CLICK HERE to read the full report at the Manhattan Institute