

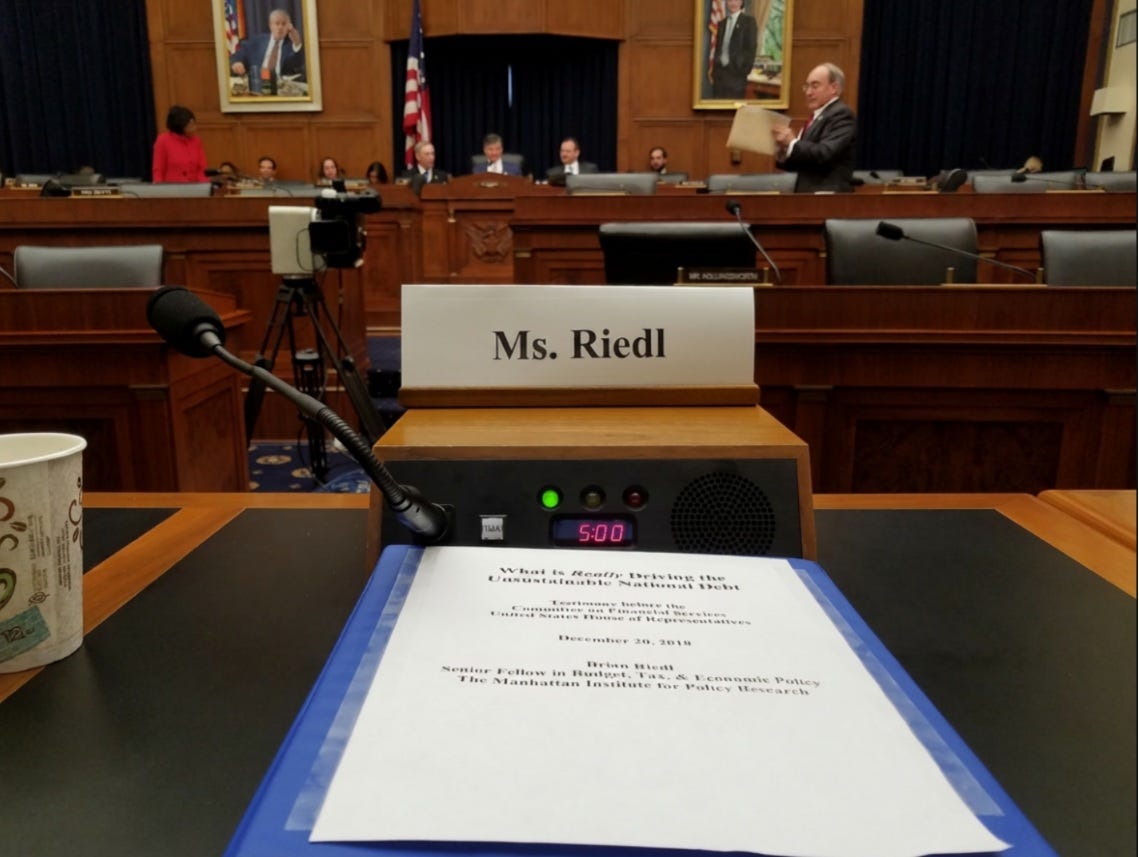
Four Principles for Responsible Infrastructure Investments
Jessica Riedl
Senior Fellow in Budget, Tax, & Economic Policy
The Manhattan Institute for Policy Research
Testimony before the Committee on Banking, Housing, and Urban Affairs
United States Senate
June 15, 2021
CLICK HERE for hearing page and video
Good morning Chairman Brown, Ranking Member Toomey, and Members of the Committee. Thank you for inviting me to participate in today’s hearing.
My name is Jessica Riedl. I am a Senior Fellow in Budget, Tax, & Economic Policy at the Manhattan Institute for Policy Research. The views I express in this testimony are my own, and should not be construed as representing any official position of the Manhattan Institute.
My testimony today will offer four principles for responsible infrastructure investments:
· First, Congress should avoid piling on new taxes or debt. The federal budget is already facing $100 trillion in baseline deficits over 30 years, and any taxes should address that first.
· Second, state and local governments should use for infrastructure the $530 billion in additional federal windfalls they have recently received. In fact, infrastructure is a perfect use of one-time federal funding.
· Third, any additional federal investments should be funded within the current $61 trillion spending baseline over the decade. The offsets are there if infrastructure is truly a Congressional priority.
· Finally, America’s main infrastructure policy challenge is not funding, but rather the slow, bureaucratic, high-cost implementation of the policies. Spending another $1 trillion without making these programs more effective is a poor use of taxpayer dollars.
As an addendum, I will show that there is a broad economic consensus that infrastructure policies do not provide short-term stimulus, and most new construction jobs are redistributed from other jobs.
Principle #1: No New Taxes or Deficits
Washington has proven to be increasingly unable to pay for its current spending commitments. It is on pace to borrow nearly $7 trillion across 2020 and 2021, and faces $100 trillion in baseline budget deficits over the next 30 years. Adding trillions more in spending will further raise the spending baseline to levels that no plausible tax system can finance. Even if this new infrastructure spending is financed with trillions in new taxes, that would still use up a large portion of the taxes that will instead be needed to address the $100 trillion in baseline deficits. Thus, lawmakers should commit to not worsen the unsustainable budget outlook by adding more debt, or diverting its limited tax options into financing new spending programs.
Let’s dive deeper into the numbers. The cost of the American Jobs Plan[1] – $2.6 trillion over 8 years, an average of 1.25 percent of GDP – would represent the most expensive non-emergency spending bill in at least 50 years.[2] And it follows Washington enacting $5.4 trillion in (mostly-necessary) pandemic spending over the past 12 months – a total that comprises one-fifth of the entire national debt. The American Families Plan would add $1.8 trillion more in spending.
The underlying fiscal outlook is unsustainable. The national debt held by the public is already projected to double from $17 trillion to $35 trillion between the end of 2019 and 2030.[3] If President Biden’s entire campaign agenda is enacted, and expiring provisions are extended, it would mean the national debt rising from $17 trillion to $44 trillion over that period.[4] This would leave the national debt at 130 percent of GDP, or one-quarter higher than at the end of World War II.
And it only gets worse thereafter. The Congressional Budget Office projects that – due overwhelmingly to escalating Social Security and Medicare shortfalls – Washington will run $100 trillion in baseline budget deficits over the next 30 years. This would leave the national debt at nearly 200 percent of GDP. At the end of that period, government interest payments will consume half of all tax revenues.[5]
That is the rosy scenario that assumes no new legislation is enacted, the 2017 tax cuts expire, no new recessions, and low interest rates. If interest rates exceed the CBO baseline assumption by even one percentage point, it would add $30 trillion in interest costs over three decades. Deficits would reach 18 percent of GDP, the debt would hit 264 percent of GDP, and two-thirds of all tax revenues would merely pay the interest on the debt.[6]
That is simply the CBO baseline, with interest rates rising by an additional percentage point.
And that is why it is shortsighted to assert that low interest rates make this the right time to borrow. Washington is behaving like a subprime homeowner and making long-term debt commitments based on short-term interest rates. The average maturity of the U.S. debt is five years and declining, which means most of the national debt would quickly roll over into any future interest rate increase.
In short, the federal government is essentially gambling our fiscal future on the hope that interest rates never again exceed four percent. Because if they do, simple math shows that combining rising interest rates with a debt approaching 200 or 300 percent of GDP risks a catastrophic debt crisis.
In that context, Washington should focus on paying for our current escalating commitments before undertaking the most expensive non-emergency spending bill in half a century.
Some suggest that fully financing this infrastructure bill with new taxes would make it fiscally responsible. That is not the case. If a family facing a $100,000 credit card debt suddenly finds a $20,000 windfall, spending it all on expensive new furniture would not be a responsible use of that money simply because it is “fully paid for” by the windfall. Similarly, there is a limited universe of plausible tax increases on families and businesses.[7]
Enacting all of these taxes would not even close the current 10-year projected budget deficit of $14.3 trillion, much less finance the President’s new spending proposals.[8] And even if they did, the escalating spending levels projected by CBO would re-open large budget deficits in the 2030s and 2040s.
In short, it will take aggressive tax increases – or drastic and painful spending cuts – just to finance Washington’s current commitments. Applying the easiest $3 trillion in taxes to a historic spending expansion simply leaves fewer options to close the remaining deficits. The only people left to pay the remaining taxes will be the middle class.
Large spending increases create the difficult financing choice between using up our limited plausible tax increases, and going deeper into debt. The American Jobs Plan includes approximately $1.8 trillion in new corporate taxes that dwarf the $300 billion in net corporate tax cuts (over ten years) enacted in the 2017 Tax Cuts and Jobs Act. That law reduced the corporate tax rate from 35 percent to 21 percent, but offset most of those savings by curtailing key business tax preferences. The president would raise the corporate rate back to 28 percent (33 percent including state taxes) – restoring America to the highest rate in the OECD – while also raising international taxes and retaining the lost 2017 tax deductions. Moreover, the president would severely weaken the 2017 tax reforms that finally gave U.S. multinational corporations a more level playing field when competing internationally. Now, once again, American companies abroad may face higher tax rates than our global competitors.
No, infrastructure won’t pay for itself through economic growth. Some advocates suggest that infrastructure spending is not a major budgetary drag because it will provide enough growth and prosperity to pay for itself, or at least become more affordable down the road. This spending version of the free-lunch Laffer Curve collapses under basic scrutiny. Infrastructure spending is not like borrowing $100,000 for a college degree that brings $1 million in higher future income. A government program requires a 500 percent return on investment to pay for itself in future tax revenues. (Imagine a $100 expenditure creating $500 in new GDP that is then taxed at the long-term average federal rate of 20 percent to bring in $100 in tax revenues.)
Do government investments typically produce a 500 percent return? Try 5 percent. A 2016 CBO report concluded that federal investments typically return only 5 percent[9] — compared with 10 percent for private-sector investments — because federal investments are costly, bureaucratic, unresponsive to market forces, and are often offset by state and local governments cutting back their own investments. Under this rate of return — and adjusted into net present values — it would take 100 years for tax revenues to recoup even 20 percent of the cost.
Moreover, this 5 percent figure refers to traditionally-defined government investments, rather than new broader definitions that include roughly $2 trillion in combined proposals for long-term care for seniors, corporate welfare, public housing, government-building renovation, child credits, and Affordable Care Act subsidies. By contrast, just $500 billion of the American Jobs Plan and American Families Plan would go toward roads, bridges, highways, airports, water transportation, and even electrical infrastructure. Some of those other policies may have merit, but they are not going to bring a historic burst of new productivity and economic growth that recoups any significant share of the initiative’s $4 trillion overall cost.
In fact, economists at the University of Pennsylvania found that the spending provisions in the American Jobs Plan would actually reduce economic growth and wages over the long-term. Any modest productivity benefits from these new public investments would be more than offset by the productivity losses caused by the necessary government borrowing crowding out more-productive private-sector investment. In other words, stronger economic growth means encouraging private-sector investment, not transferring those resources to the government. Specifically, the Penn-Wharton Budget Model projected that the infrastructure spending in the American Jobs Plan will – over the long run:
· Create no net jobs;
· Reduce wages by 0.3 percent (0.8 percent when including the proposed taxes);
· Reduce the capital stock by 1.5 percent (3.0 percent when including the proposed taxes);
· Reduce the GDP by 0.3 percent (0.8 percent when including the proposed taxes).[10]
So not only would the president’s infrastructure proposal fail to produce the 500 percent return needed to pay for itself, it would likely produce a negative overall return.
Additionally, on the tax side of the proposal, the Tax Foundation estimates that:
“An increase in the federal corporate tax rate to 28 percent would raise the U.S. federal-state combined tax rate to 32.34 percent, highest in the OECD and among Group of Seven (G7) countries, harming U.S. economic competitiveness and increasing the cost of investment in America. We estimate that this would reduce long-run economic output by 0.8 percent, eliminate 159,000 jobs, and reduce wages by 0.7 percent. Workers across the income scale would bear much of the tax increase. For example, the bottom 20 percent of earners would on average see a 1.45 percent drop in after-tax income in the long run.”[11]
Principle #2: States Should Use Their Federal Windfalls
State and local governments have received more than $850 billion from the federal government’s pandemic emergency bills.[12] A portion of this spending was for necessary costs related to public health. On the flip side, state and local governments recently received $350 billion to close budget deficits that – for the most part – no longer exist. California’s state government received $26 billion (and their local governments received an extra $16 billion)[13] despite facing a $75 billion surplus for the upcoming fiscal year.[14] My home state of Wisconsin has reported an “unprecedented” revenue surge and projects a $5.8 billion surplus over the next two years – enough to rebate 30 percent of all state income taxes.[15] And yet the state will receive an additional $2.5 billion bailout from Washington D.C. to address a budget shortfall that does not exist. These stories are being repeated across America: State and local governments with large one-time cash windfalls that they do not know how to spend, as well as frustration of strings attached on federal funds they are receiving.
States are also holding approximately $180 billion in unspent K-12 education grants from earlier relief bills.[16] This money is purportedly to cover pandemic-related renovations and costs, but CBO estimates that most will not be spent until between 2023 and 2028, likely well after COVID has passed.[17]
All in all, state and local governments are sitting on more than $500 billion in federal funds, the vast majority of which lacks any clear direct purpose. It would be irresponsible for states to create new permanent spending programs that outlast this temporary cash windfall, and Washington has tried (perhaps unconstitutionally) to forbid these states from cutting taxes. Thus, applying most of that $500 billion towards a one-time infrastructure boost makes the most sense.
This amount is well sufficient for most states. Government at all levels spends approximately $235 billion annually on highways, roads, and bridges,[18] split equally between capital improvements and maintenance.[19] Even applying half of the states’ $500 billion towards highways, roads, and bridges would more than double the $115 billion in the President’s plan, and amount to a doubling of their total budget – surely enough to meaningfully address any backlog (without Washington micromanagement of the projects).
And it would cost taxpayers nothing above what Congress has already distributed.
Additional state spending can go towards other infrastructure needs such as modernizing the electrical grid, purifying the water supply, improving broadband access, or renovating schools. Even putting $100 billion into these priorities would represent “moonshot” reforms over current spending levels.
The key question is how to encourage state and local governments to apply these funds towards infrastructure. Congress could offer perhaps $150 billion in infrastructure matching funds (this is still much cheaper than Washington spending $2 trillion) and also pass legislation freeing up the education funds for broader infrastructure uses. At the same time, if governors truly resist investing their large windfalls in infrastructure, that may be a sign to Washington that it is less of a national priority after all.
Principle #3: Washington Can Add Spending Within the Current Budget
It is not unreasonable for Washington to contribute somewhat more to infrastructure, whether through matching funds for states, or truly national projects like interstate waterways or rail. But Washington is already projected to spend more than $60 trillion over the next decade. If it cannot apply $500 billion of that amount towards infrastructure priorities – less than one percent of the budget – then it is fair to question how serious Congress and the President are about infrastructure. Congress already spends $306 billion annually on non-defense investment (including $112 billion for physical infrastructure), and should be able to repurpose some of this spending.[20]
The most straightforward carve-out would bring back caps in discretionary spending. Rather than drastically increase this spending by 8.4 percent as President Biden has proposed, Washington could save $500 billion over the decade by cutting that budget by 1.5 percent in 2021, and then capping its annual growth at the inflation rate over the decade. Alternatively, Congress could inflation-adjust federal spending using the more accurate chained CPI, sell hundreds of billions worth of excess federal assets and land, or even begin broader entitlement reforms.[21] Some modest rescissions of leftover pandemic spending may be available as well. The money is there if Congress wants to pay for infrastructure.
As an alternative to taxing the rich, I have recently released a report proposing upwards of $1 trillion in potential savings over the decade from reducing spending benefits for these same upper-income families.[22] This includes slightly trimming Social Security benefits and raising Medicare premiums for retirees with millions in financial assets, and reducing farm subsidies for families earning more than $300,000 annually. Spending savings are never easy or popular, but living within our means and building a sustainable federal budget means that new priorities should be offset with lower-priority savings.
Principle #4: Reform Infrastructure Waste and Delays – Do Not Throw Money at an Unreformed, Broken System
The easiest answer to most political problems is simply to throw more money at them. Yet America’s infrastructure is not held back by low spending levels, but rather by its status among the world’s most expensive, bureaucratic, and slowly built. It has become cliché to contrast the 410 days needed to build the Empire State Building in 1930-31 with the more recent 25-year process of building Boston’s “Big Dig.” Yet the persistence of delays, cost-overruns, and death-by-NIMBYism can be seen today in California’s high-speed rail project that is now expected to take nearly 40 years from planning to completion (which itself is increasingly unlikely) and cost $70 billion more than originally-estimated.
Our infrastructure can certainly use some upgrades, particularly its roads and electrical grid. That said, the crumbling state of American infrastructure has been overstated. A 2019 report of the World Economic Forum ranked the United States’ infrastructure first among the 10 geographically largest countries (i.e., the countries that likely have the most extensive infrastructure needs).[23]
Similarly, last year a Congressional Research Service report titled “The Condition of Highway Bridges Continues to Improve” noted that “the number and share of bridges in poor condition have dropped significantly over the past 20 years. Furthermore, repairing every deficient bridge in just a few years is unrealistic, and not every bridge repair is likely to be justified when considering both the economic benefits and costs. FHWA’s own analysis of bridge data suggests a relatively modest increase in spending could substantially reduce or eliminate the backlog of economically justifiable investments if sustained over a 20-year period.”[24]
Spending levels remain healthy. Transportation infrastructure spending (adjusted for inflation) rose from $332 to $371 billion between 2008 and 2018.[25] Government spending on transportation and water infrastructure at all levels is 2.3 percent of the GDP ($440 billion), just slightly below the 30-year average of 2.5 percent.[26] That said, there has been a modest shift from capital spending to operations and maintenance. Spending on energy and the electrical grid continues to rise, although challenges remain.[27]
America’s main infrastructure challenge is not spending levels, but rather its general ineffectiveness per dollar spent. In 2016, CBO released a report entitled “The Macroeconomic and Budgetary Effects of Federal Investment.” Economist Scott Hodge succinctly summarizes the reports three leading conclusions:[28]
1. “Federal investments deliver only half the economic returns as private sector investments, 5 percent versus 10 percent.
A dollar of federal spending results in only $0.67 worth of actual investment because state, local, and private sector entities reduce their spending in response to the federal dollars.
Federal investment financed by debt or taxes could do more economic harm than good because federal borrowing and taxes crowd out private investment. To avoid harming the economy, federal investments should be financed by cuts in other discretionary programs.”
Diving deeper, America’s transportation infrastructure is among the most expensive, bureaucratic, and slowly built in the world.[29] Consider that:
· The cost of interstate construction spending per mile quadrupled from 1960 through 1990, and has continued to grow since then (adjusted for inflation).[30]
· Labor costs are higher in part because the Davis-Bacon Act, which mandates that those awarded government contracts pay a “prevailing wage,” raises wage costs by as much as 22 percent.[31]
· Government-mandated project labor agreements (PLAs) have been shown to significantly raise labor costs as well.[32]
· America requires many more workers to do the same construction work as Europe.[33]
· Most U.S. construction projects are performed only during the workday, while much of Europe has round-the-clock shifts.[34]
· U.S. subway systems are by far the most expensive to build in the world, and in New York City cost quadruple the world average to build. The difference is high labor costs, poor contractor work, poor oversight, and defensive designs meant to avoid a cascade of stakeholder lawsuits related to environmental and historical artifact protection.[35]
· Coordination between various local governments and stakeholders – while often necessary – brings endless delays and veto points, particularly for transportation projects.
· Nearly a century ago, the Empire State Building was built in 410 days. More recently, Boston’s Big Dig took 25 years from planning to completion. Today, California’s high-speed rail is expected to take nearly 40 years from planning to completion. Some delays are helpful – we want to ensure safety and environmental protection – but the U.S. has become a global outlier.
A major cause of delays are the necessary-but-slow Environmental Impact Statements and Historical Artifact Reviews. Consider that:
· Environmental reviews commonly exceed 1,000 pages and require on average seven years to complete (compared to no more than one to two years in Canada and 3.5 years in the European Union).[36]
· Several environmental impact statements now take more than 17 years to complete – and no ground can be broken until the project has survived the legal process, including appeals by any litigant.[37]
· In America – unlike many other countries – environmental and historical reviews can be challenged in court by a wide range of stakeholders, and these challenges can take years or even decades to be decided. Other countries use faster, non-judicial options to enforce these regulations, rather than expensive and time-consuming lawsuits that essentially become a project veto.[38]
· Megan McArdle cites an egregious example: “The Southeastern High Speed Rail Corridor was proposed in 1992. You will be thrilled to learn that in September 2017, the Department of Transportation announced the completion of the project’s Tier II Draft Environmental Impact Statement.”[39]
President Biden’s physical infrastructure component throws $1 trillion at this broken system. In fact, it would raise costs further by tightening higher-wage requirements and imposing stricter “Buy America” requirements that limit trade and lower-cost options. And it allocates more funding to transit and high-speed rail ($165 billion) than highways, roads, and bridges ($115 billion) despite the surging costs[40] and declining public interest[41] in the former.
There is certainly a case for increasing infrastructure investment. But any new funding should be accompanied by reforms to spend that money more effectively.
The $213 billion proposal to build, rehabilitate, and retrofit millions of homes is expensive and vaguely defined. While public housing should obviously not be left in disrepair, lawmakers should focus more on housing vouchers that provide low-income families with more options to escape public housing if they so choose. Thus, building more private housing and addressing zoning restrictions would be more helpful. That said, local communities must play a lead role. Additionally, the proposal to “build, preserve, and retrofit homes” is vaguely defined, and it is unclear if tax credits will be sufficient to bring such expensive projects – especially given the push for more expensive unionized workers in an industry that is only 13 percent unionized.[42]
Additionally, the proposed $100 billion for K-12 school construction and renovation ($50 billion in direct grants plus $50 billion through bonds) is unnecessary. School construction has long been a responsibility of state and local governments, and federalizing this role engages in mission creep while diminishing the role of the governors, mayors, and school boards closer to these schools. Furthermore, states are flush with $180 billion in K-12 grants from earlier pandemic bills that well exceed their COVID-related expenses (which is why CBO assumes most will not be spent until between 2023 and 2028).[43] Congress should clarify that these $180 billion in recent grant funds may be used for broader education expenses.
Addendum: Economists Agree that Infrastructure is not “Stimulus” or Job Creation
Finally, let’s address the “jobs” portion of the American Jobs Plan. The Biden Administration and other advocates assert that massive infrastructure spending will stimulate short-term economic growth and create jobs.
Economists across the political spectrum have debunked this myth for the obvious reason that infrastructure projects require several years of planning and regulatory reviews before they begin – at which point the economy has already recovered. In fact, as stated above, environmental impact statements typically take seven years to complete. After allocating $94 billion for mostly “shovel-ready” stimulus projects in 2009, President Obama later joked that “Shovel-ready was not as … shovel-ready as we expected.”
Former Obama White House chief economist Jason Furman and former Congressional Budget Office director Doug Elmendorf added that “In the past, infrastructure projects that were initiated as the economy started to weaken did not involve substantial amounts of spending until after the economy had recovered.”[44]
Delays are not the only stimulus barrier. Stanford economists John Cogan and John Taylor observed that state and local governments receiving 2009 federal stimulus infrastructure grants simply cut back on their own spending and borrowing almost dollar-for-dollar, completely negating the impact of the federal spending.[45]
The stimulus case is also undermined by Washington distributing spending largely based on politics rather than local economic needs. Harvard economist Edward Glaeser revealed that 2009 stimulus dollars were disproportionately distributed to regions with lower unemployment rates that did not need stimulus. On one level, this makes sense -- many high unemployment regions are rural or losing population, and are thus not the best candidates for widening local highways or adding high-speed rail. However, this approach exposes the disconnect between the goals of infrastructure and job creation. Glaeser also writes that, unlike the past infrastructure projects that relied more on manual labor, today’s “big infrastructure requires fancy equipment and skilled engineers, who aren’t likely to be unemployed.”[46]
Because of these factors, a review of 2009 stimulus highway projects shows no sustained effect on county-level employment.[47] Another study found that half of all new employees hired at firms that received stimulus dollars had peen poached from other firms (rather than coming from the ranks of the unemployed), and many of these companies were forced to turn down other construction projects to accommodate the new “stimulus” projects.[48]
Overall, CRS examined highway spending and concluded that “to the extent that financing new highways [comes from] reducing expenditures on other programs or by deficit finance . . . the net impact on the economy of highway construction in terms of both output and employment could be nullified or even negative.”[49]
Adherents to the infrastructure stimulus argument should consider the case of Japan, which responded to a sustained economic downturn with $6.3 trillion in infrastructure investment between 1991 and 2008.[50] One of the largest investments in airports, trains, highways, and tunnels in world history helped push Japan’s national debt from 38 percent to 140 percent of GDP, yet its per-capita GDP was roughly the same in 2008 as in 1994.
Third, political considerations can limit the stimulative effect of infrastructure. The geographic distribution of infrastructure spending has historically been driven by the political leverage of lawmakers, as well as political considerations within federal agencies. It is naïve to expect politics remove to be removed from the allocations.
Consequently, Washington has historically over-invested in large vanity projects that provide ribbon-cutting ceremonies. such as high-speed rail, the expansion of interstate highways, and the famous (and eventually cancelled) $223 million “Bridge to Nowhere.” However, economist Aaron Renn has shown that “America’s infrastructure crisis is local,” and repairing local streets, bridges, and potholes is a much higher and more affordable priority. These locally managed projects are often ineligible for federal funding.[51]
State governments face their own mis-aligned incentives with federal dollars. A state funding a $100 million project with its own transportation revenues must convince its taxpayers that the project will provide $100 million in value. By contrast, if the state is required to put up just $20 million of its own funds -- and can use a federal infrastructure grant for the remaining $80 million -- it need only convince its citizens that the project is worth $20 million. In other words, the ability to offload the costs on the federal government makes states more cavalier with how the funds are spent.
Consequently, past infrastructure stimulus bills and reauthorizations have not sufficiently relieved traffic congestion, repaired bridges and roads, or improved waterways. Instead, they brought unfinished high-speed rail projects, cost overruns, a $3.4 million “eco-passage”[52] to help turtles cross a highway in Tallahassee, Fla., and a $54 million “Napa Valley Wine Train.”[53] Better to eliminate the federal middleman and empower state and local governments to more easily raise the funds to finance local projects based on local priorities.
Conclusion: Fix the System First, and Be Fiscally Responsible
The laws of economics have not been repealed. Budget constraints still exist. Doubling or tripling the national debt is extraordinarily reckless. There is no guarantee that interest rates will never rise again – indeed such a result is overwhelmingly likely. There are no plausible taxes that can finance the projected spending levels, and counting on the Federal Reserve to monetize much of this debt is a recipe for economic chaos.
Spending $1 trillion on infrastructure without fixing the underlying waste, inefficiencies, and delays in our system represents an extraordinary missed opportunity, and confuses spending levels with outcomes. Lawmakers should first reform the infrastructure costs and delays, and encourage states to use their $530 billion in federal aid to address local infrastructure priorities.
[1] White House, “Fact Sheet: The American Jobs Plan,” March 31, 2021, at https://www.whitehouse.gov/briefing-room/statements-releases/2021/03/31/fact-sheet-the-american-jobs-plan/.
[2] Preliminary cost estimate from “What’s in President Biden’s American Jobs Plan?” Committee for a Responsible Federal Budget, April 2, 2021 at https://www.crfb.org/blogs/whats-president-bidens-american-jobs-plan.
[3] Congressional Budget Office, The Budget and Economic Outlook: 2021 to 2031,” February 11, 2021, at https://www.cbo.gov/publication/56970. CBO projected a debt held by the public of $33.3 trillion at the end of FY 2030, before the latest stimulus bill added $2 trillion.
[4] Cost estimates of Biden campaign proposals are at Jessica Riedl, “Joe Biden Has an $11 Trillion Spending Plan. Can He Enact It?” The Dispatch, September 3, 2020, at
https://thedispatch.com/p/joe-biden-has-an-11-trillion-spending
. Most of the $11 trillion spending breakdown comes from the Biden campaign itself, and the $3.5 trillion in taxes comes from the Brookings/Urban Tax Policy Center.
[5] Calculated using Congressional Budget Office, “The 2020 Long-Term Budget Outlook,” at September 21, 2020, at https://www.cbo.gov/publication/56516 and the “Long-Term Budget Projections” tab.
For more analysis of these long-term deficits, see Jessica Riedl, “Spending, Taxes, & Deficits: A Book of Charts,” Manhattan Institute, October 26, 2020.
[6] Calculated using Congressional Budget Office, “The 2020 Long-Term Budget Outlook,” at September 21, 2020, at https://www.cbo.gov/publication/56516 and the “Long-Term Budget Projections” tab.
[7] For a sample proposal to stabilize the long-term debt, see Jessica Riedl, “A Comprehensive Federal Budget Plan to Avert a Debt Crisis,” Manhattan Institute, October 10, 2018, at https://www.manhattan-institute.org/html/report-comprehensive-federal-budget-plan-avert-debt-crisis-11497.html.
[8] Congressional Budget Office, The Budget and Economic Outlook: 2021 to 2031,” February 11, 2021, at https://www.cbo.gov/publication/56970. CBO projected a $12.3 trillion deficit from FY 2022-2031, before the latest $2 trillion stimulus bill.
[9] Congressional Budget Office, The Macroeconomic and Budgetary Effects of Federal Investment,” June 2016 at https://www.cbo.gov/sites/default/files/114th-congress-2015-2016/reports/51628-Federal_Investment.pdf.
[10] “President Biden’s $2.7 Trillion American Jobs Plan: Budgetary and Macroeconomic Effects,” Penn-Wharton Budget Model, April 7, 2021, at https://budgetmodel.wharton.upenn.edu/issues/2021/4/7/president-biden-american-jobs-plan-effects.
[11] Garrett Watson and William McBride, “Evaluating Proposals to Increase the Corporate Tax Rate and Levy a Minimum Tax on Corporate Book Income,” Tax Foundation, February 24, 2021, at https://taxfoundation.org/biden-corporate-income-tax-rate/.
[12] Committee for a Responsible Federal Budget, “COVID Money Tracker,” at
https://www.covidmoneytracker.org/
.
[13] Committee for a Responsible Federal Budget, “State and Local Governments Do Not Need Half a Trillion in COVID Relief,” February 17, 2021 at https://www.crfb.org/blogs/state-and-local-governments-do-not-need-half-trillion-covid-relief.
[14] Kevin Yamamura, “California has a staggering $75.7B budget surplus,” Politico, May 10, 2021, at https://www.politico.com/states/california/story/2021/05/10/california-has-a-staggering-757b-budget-surplus-1381195.
[15] Mitchell Schmidt, “Wisconsin projects $4.4B more in tax revenue by mid-2023 following ‘unprecedented’ tax collections,” Wisconsin State Journal, June 9, 2021, at
[16] The most recent stimulus law contained $129 billion that is purportedly for school mitigation measures to accommodate social distancing and pandemic risks. However, the CDC has estimated that school mitigation strategies should cost no more than $23 billion. Moreover, education policy expert Dan Lips notes that state and local governments are still sitting on more than $50 billion in unused K-12 school relief funds from earlier emergency bills.
[17] Congressional Budget Office, “Cost Estimate: Reconciliation Recommendations of the House Committee on Education and Labor,” February 17, 2021, https://www.cbo.gov/system/files/2021-02/hEdandLaborreconciliationestimate.pdf.
[18] Bureau of Transportation Statistics, “Transportation Expenditures by Mode and Level of Government From Own Funds, Fiscal Year,” Department of Transportation, at https://www.bts.gov/content/transportation-expenditures-mode-and-level-government-own-funds-fiscal-year-current-millions.
[19] Congressional Budget Office, “Reauthorizing Federal Highway Programs: Issues and Options, May 2020 at https://www.cbo.gov/publication/56373.
[20] Congressional Budget Office, “Budgeting for Federal Investment,” April 15, 2021, at https://www.cbo.gov/publication/56900.
[21] For a detailed, gimmick-free, fully-scored blueprint to stabilize the long-term debt, see Jessica Riedl, “A Comprehensive Federal Budget Plan to Avert a Debt Crisis,” Manhattan Institute Report, October 10, 2018 at https://www.manhattan-institute.org/html/report-comprehensive-federal-budget-plan-avert-debt-crisis-11497.html
[22] For details, see Jessica Riedl, “Cut Spending For The Rich Before Raising Their Taxes,” Manhattan Institute Report, May 20, 2021 at https://www.manhattan-institute.org/cut-spending-rich-raising-their-taxes.
[23] Klaus Schwab (editor), The Global Competitiveness Report: 2019, World Economic Forum, at http://www3.weforum.org/docs/WEF_TheGlobalCompetitivenessReport2019.pdf. For a discussion, see also Charles Lane, “No, America’s infrastructure is not ‘crumbling’,” Washington Post, April 6, 2021 at https://www.washingtonpost.com/opinions/no-americas-infrastructure-is-not-crumbling/2021/04/06/ab97cc50-9554-11eb-a6d0-13d207aadb78_story.html.
[24] William J. Mallett, “Condition of Highway Bridges Continues to Improve,” Congressional Research Service Insight #IN11395, May 19, 2020, at https://crsreports.congress.gov/product/pdf/IN/IN11395.
[25] Bureau of Transportation Statistics, “Transportation Expenditures by Mode and Level of Government From Own Funds, Fiscal Year,” Department of Transportation, at https://www.bts.gov/content/transportation-expenditures-mode-and-level-government-own-funds-fiscal-year-current-millions. Figures then adjusted for inflation.
[26] Congressional Budget Office, “Public Spending on Transportation and Water Infrastructure, 1956 to 2017,” October 2018 at https://www.cbo.gov/system/files/2018-10/54539-Infrastructure.pdf.
[27] American Society of Civil Engineers, “2021 Report for America’s Infrastructure,” Energy chapter, at https://infrastructurereportcard.org/cat-item/energy/.
[28] Summary appears at Scott A. Hodge, “CBO Study: Benefits of Biden’s $2 Trillion Infrastructure Plan Won’t Outweigh $2 Trillion Tax Hike,” Tax Foundation, March 31, 2021, at https://taxfoundation.org/biden-infrastructure-spending-tax-hike/. For full report, see Congressional Budget Office, The Macroeconomic and Budgetary Effects of Federal Investment,” June 2016 at https://www.cbo.gov/sites/default/files/114th-congress-2015-2016/reports/51628-Federal_Investment.pdf.
[29] For an overview, see Josh Barro, “Why New York Can’t Have Nice Things. It costs three times more to build a subway station here than in London or Paris. What if we could change that?” New York Magazine, May 30, 2019, at https://nymag.com/intelligencer/2019/05/new-york-infrastructure-costs.html. Josh Barro, “Here’s Why We’ve Failed to Figure Out Why Infrastructure Costs So Much,” New York Magazine, July 24, 2019, at https://nymag.com/intelligencer/2019/07/why-we-cant-figure-out-why-infrastructure-is-so-expensive.html. Alex Marshall, “Why Can’t We Build Infrastructure Cheaply, Quickly and Well?” Governing, April 16, 2020, at https://www.governing.com/community/Why-Cant-We-Build-Infrastructure-Cheaply-Quickly-and-Well.html.
[30] Alon Levy, “So You Want to Do an Infrastructure Project,” Niskanen Center, March 16, 2021, at https://www.niskanencenter.org/wp-content/uploads/2021/03/levy-infastructure.pdf.
[31] Sarah Glassman, Michael Head, David G. Tuerck, and Paul Bachman, “The Federal Davis-Bacon Act: The Prevailing Mismeasure of Wages,” The Beacon Hill Institute at Suffolk University, February 2008, http://www.beaconhill.org/bhistudies/prevwage08/davisbaconprevwage080207final.pdf.
[32] For a background discussion of PLAs, see William F. Burke, BSBA, David G. Tuerck, Ph.D, “The Effects of Project Labor Agreements on Public School Construction in Connecticut,” The Beacon Hill Institute, January 2020, at https://beaconhill.org/wp-content/uploads/2020/02/CT-PLA-FinalRev-2020-0211.pdf.
[33] Alex Marshall, “Why Can’t We Build Infrastructure Cheaply, Quickly and Well?” Governing, April 16, 2020, at https://www.governing.com/community/Why-Cant-We-Build-Infrastructure-Cheaply-Quickly-and-Well.html.
[34] Alon Levy, “So You Want to Do an Infrastructure Project,” Niskanen Center, March 16, 2021, at https://www.niskanencenter.org/wp-content/uploads/2021/03/levy-infastructure.pdf.
[35] Alon Levy, “So You Want to Do an Infrastructure Project,” Niskanen Center, March 16, 2021, at https://www.niskanencenter.org/wp-content/uploads/2021/03/levy-infastructure.pdf.
[36] Mitch Daniels, Testimony before Senate Finance Committee, June 25, 2015, at https://www.purdue.edu/president/speeches/2015/150625-infrastructure-testimony.pdf.
[37] Alon Levy, “So You Want to Do an Infrastructure Project,” Niskanen Center, March 16, 2021, at https://www.niskanencenter.org/wp-content/uploads/2021/03/levy-infastructure.pdf.
[38] Alon Levy, “So You Want to Do an Infrastructure Project,” Niskanen Center, March 16, 2021, at https://www.niskanencenter.org/wp-content/uploads/2021/03/levy-infastructure.pdf.
[39] Megan McArdle, Twitter, February 13, 2019, at

.
[40] Kerry Jackson, “The Low Spark of High-Speed Rail: California’s bullet-train project is still under construction as delays and costs pile up,” at February 25, 2021, at https://www.city-journal.org/high-costs-construction-delays-plague-ca-high-speed-rail.
[41] Randal O’Toole, “Transit: The Urban Parasite. The costs of supporting the nation’s urban transit industry are rising, yet ridership is declining.” Cato Institute, Policy Analysis No. 889, April 20, 2020, at https://www.cato.org/policy-analysis/transit-urban-parasite.
[42] Bureau of Labor Statistics, “Union Members – 2020: Table 3. Union affiliation of employed wage and salary workers by occupation and industry” January 22, 2021, at https://www.bls.gov/news.release/union2.t03.htm.
[43] The most recent stimulus law contained $129 billion that is purportedly for school mitigation measures to accommodate social distancing and pandemic risks. However, the CDC has estimated that school mitigation strategies should cost no more than $23 billion. Moreover, education policy expert Dan Lips notes that state and local governments are still sitting on more than $50 billion in unused K-12 school relief funds from earlier emergency bills. Then what is the purpose of this additional $129 billion? Certainly not to address the pandemic; the CBO calculates that more than two-thirds of this spending would occur between 2023 and 2028.
[44] Lori Montgomery, “Critics Say Roads Projects Won’t Jump-Start Economy,” Washington Post, October 30, 2008 at https://www.washingtonpost.com/wp-dyn/content/article/2008/10/29/AR2008102904125.html.
[45] John Cogan and John Taylor, “The Obama Stimulus Impact? Zero,” Wall Street Journal, December 9, 2010, at https://www.wsj.com/articles/SB10001424052748704679204575646603792267296.
[46] Edward L. Glaeser, “If You Build It . . .Myths and realities about America’s infrastructure spending,” City Journal Summer 2016, at https://www.city-journal.org/html/if-you-build-it-14606.html.
[47] Edward L. Glaeser, “If You Build It . . .Myths and realities about America’s infrastructure spending,” City Journal Summer 2016, at https://www.city-journal.org/html/if-you-build-it-14606.html.
[48] Garett Jones and Daniel M. Rothschild, “The Limits of Infrastructure Stimulus,” Mercatus Center, Policy Brief, March 25, 2020 at https://www.mercatus.org/system/files/rothschild_and_jones_-_policy_brief_-_covid_series_-_lessons_learned_from_arra_for_infrastructure_stimulus_-_v1.pdf.
[49] David J. Cantor, “Highway Construction: Its Impact on the Economy,” Congressional Research Service Report for Congress No. 93-21E, January 6, 1993.
[50] Edward L. Glaeser, “If You Build It . . .Myths and realities about America’s infrastructure spending,” City Journal Summer 2016, at https://www.city-journal.org/html/if-you-build-it-14606.html.
[51] Aaron M. Renn, “Beyond Repair: America’s Infrastructure Crisis Is Local,” Manhattan Institute Issue Brief, October 22, 2015, at https://www.manhattan-institute.org/html/beyond-repair-america%E2%80%99s-infrastructure-crisis-local-7943.html.
[52] Scott Mayerowitz and Nathalie Tadena, “Stimulus Waste? The $3.4 Million Turtle Crossing,” ABC News, July 9, 2009, at https://abcnews.go.com/Business/Economy/story?id=8045022&page=1.
[53] Jonathan Karl, Michael Callahan, and Kristina Wong, “Public Stimulus Funds Spent on Private Wine Train,” ABC News, February 1, 2010, https://abcnews.go.com/GMA/public-stimulus-funds-spent-private-wine-train/story?id=9721488.